


Stocks Russell 2000 Index Completes Significant Stocks Bear Market Signal
Stock-Markets / Stocks Bear Market Apr 04, 2016 - 11:30 AM GMT

 This article presents an analysis of the Russell 2000 index which is a US small-cap stock market index covering the bottom 2,000 stocks in the Russell 3000 index.
- The US Russell 2000 stock market index was commissioned in 1984 and has been in use for 32 years, along with the Russell 1000 index and the Russell 3000 index.
- Recently, at the end of Q1 2016, the Russell 2000 index completed a key bear market signal.
- Throughout the 32 years of the Russell 2000 index, this bear market signal has only been recorded once previously, and that was in early 2008 at the start of the previous major downturn often called the Great Recession.
- Price projection calculations indicate that the Russell 2000 has much further to fall, perhaps leading the major large cap US indexes down.
- There is some evidence to suggest that this downturn of the Russell 2000 may continue for a further 12 to 24 months before reaching a final bottom.
INTRODUCTION
The Russell 2000 index is a small-cap stock market index covering the bottom 2,000 stocks in the Russell 3000 Index. In contrast, the Russell 1000 covers the top 1,000 stocks of the Russell 3000 index.
The Russell 2000 index is the most widely quoted measure of the overall performance of small-cap company shares. The index represents approximately 10% of the total market capitalization of the larger Russell 3000 index. For this reason, the Russell 1000 and 3000 indexes are together quite similar in their movement, while the Russell 2000 is somewhat different in its movement from the Russell 1000 and Russell 3000 indexes, whereby the Russell 2000 captures the performance of the much smaller capitalized stocks.
Hence, the bear market signal presented in this article has only been recorded by the Russell 2000 index and has not been recorded by either the Russell 1000 or the Russell 3000.
The Russell 2000 is a common benchmark for mutual funds that identify themselves as small-cap, while the S&P 500 index is used primarily for large cap stocks. The Russell 2000 index first traded above the 1,000 level in May, 2013 and had remained above that level right up until early this year when the recent pullback took the index briefly back below that level for a short period.
PREDICTION MADE IN DECEMBER 2015
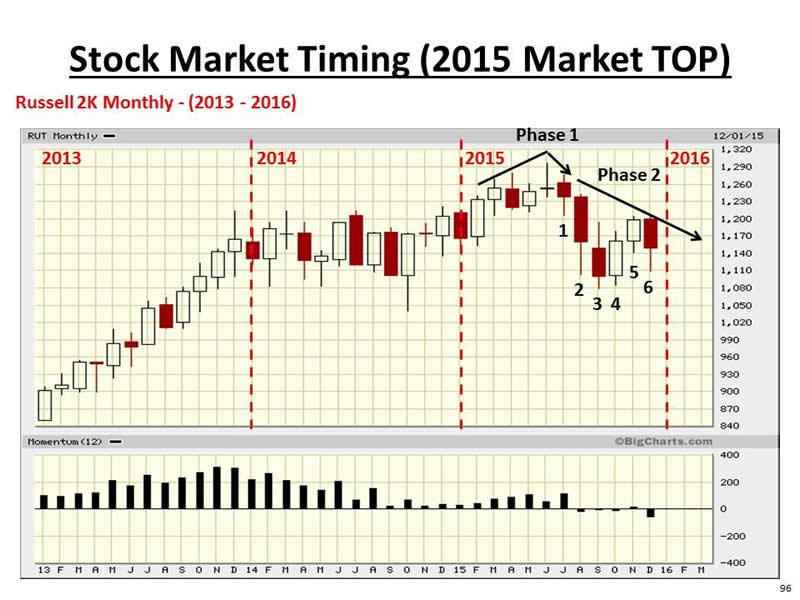
In early December 2015, analysis of the Russell 2000 monthly charts showed that a powerful downwards move was beginning to form.
Specifically, a downwards momentum sequence of potentially three phases had begun with 'phase 1' already in place and 'phase 2' over half way complete with six candlesticks in place. In the sequence, 'phase 2' takes exactly nine candlesticks to complete, so it was anticipated that 'phase 2' would complete at the end of March 2016, leading to perhaps the beginning of the final 'phase 3'.
The chart below shows the initial 'phase 1' and partial 'phase 2', and was presented by the author at the December 2015 General Meeting of the NYC Investor Meet-Up Group in Manhattan, New York.
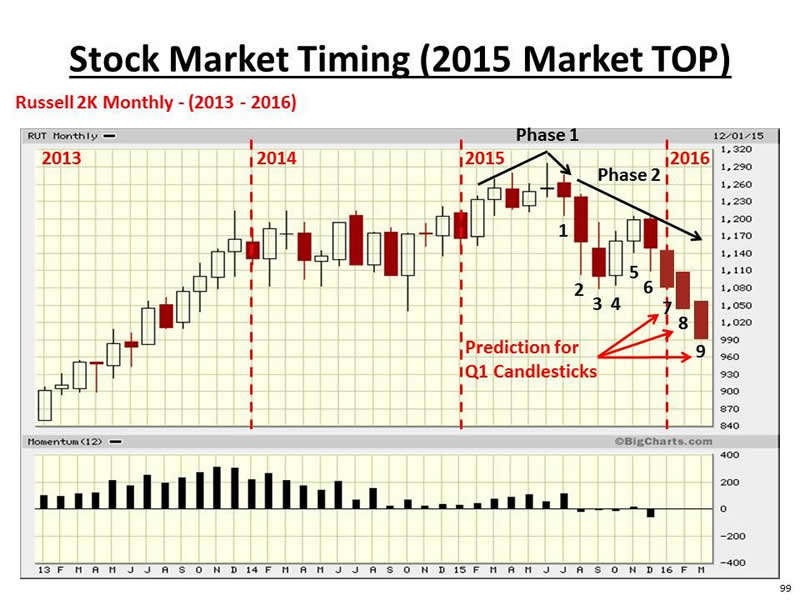
A prediction was made at the meeting that 'phase 2' would in fact complete successfully at the end of March and that 'phase 3' would then commence dragging the Russell 2000 index lower and perhaps leading the larger cap indexes down into a bear market.
The next chart below (from the presentation in December) shows a possible path for the remaining three candlesticks required to complete the nine candlesticks that form 'phase 2'.
A new mathematical model, developed by the author, had already predicted, in late 2015, that there would be a significant downturn into early Q1 2016, and this prediction was presented in the article "NEW Mathematical Model For Predicting The NEXT US Stock Market Flash Crash" which can be found here.
CALCULATION OF DOWNWARD MOMENTUM PHASES
This section takes a brief pause to explain the calculation of the phases shown in the section above. A downwards momentum sequence consist of three phases (1,2 & 3) which help to map out the movement of a stock price or index through a pullback. Inversely, an upwards momentum sequence is identical in each and every respect except that every calculation or rule is done in reverse. Although monthly charts are used here, the calculations work with any time-frame.
A 'phase 1' segment consist of six candlesticks. The close of the fifth candlestick must be above the close of the first candlestick, and the close of the final sixth candlestick must be below the close of the second candlestick. This defines a change in direction from upwards to downwards.
Once 'phase 1' has defined a change in direction there is an acceleration phase called 'phase 2' where the pace of the downwards movement usually picks-up momentum. A 'phase 2' segment consists of nine candlesticks back-to-back, however, the first candlestick is always the last (sixth) candlestick of 'phase 1'. Each candlestick of 'phase 2' must close below the close of the candlestick four positions earlier. The 'phase 2' segment can only complete if this rule remains unbroken for all nine candlesticks. If the rule is broken at anytime then the calculation starts again with the search for an initial 'phase 1' segment.
A 'phase 3' segment can only begin once 'phase 2' completes. After the acceleration provided by 'phase 2' there follows a consolidation 'phase 3' during which the downwards movement continues lower, but often at a slower pace than during 'phase 2'. The rule for 'phase 3' is a little more relaxed than 'phase 2' in as much as the test for each candlestick to be a valid part of 'phase 3' is for the close to be below the low of the candlestick two positions earlier. The third phase tends to complete when thirteen candlesticks satisfy the rule for 'phase 3', however, the candlesticks do not need to be back-to-back in 'phase 3' as they do in 'phase 2'. Once 'phase 3' completes then the whole sequence of three phases is ended.
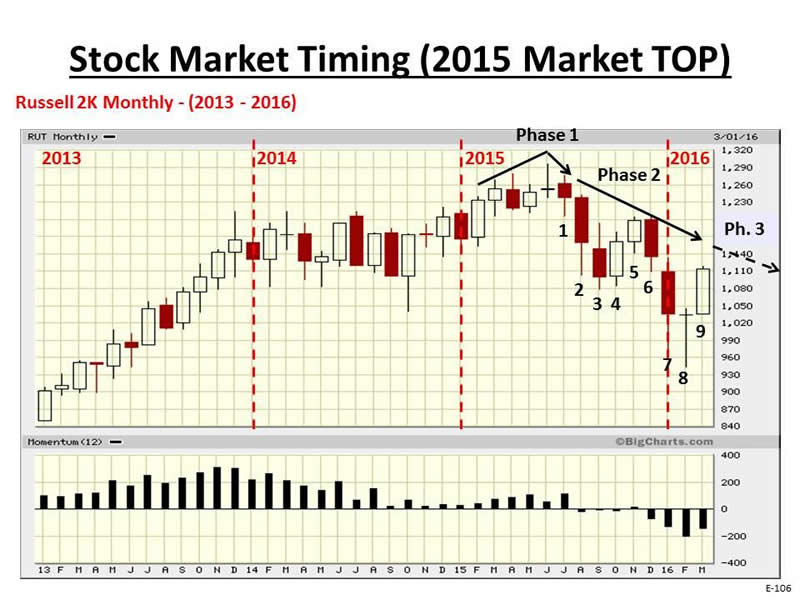
BEAR MARKET SIGNAL RECORDED MARCH 2016
Once Q1 2016 ended last week, it was possible to confirm that the original prediction for completion of 'phase 2' was successful. The chart below shows the monthly view of the Russell 2000 index and the completion of 'phase 2' and the continuation of 'phase 3' beyond.
BIG PICTURE VIEW FOR THE RUSSELL 2000
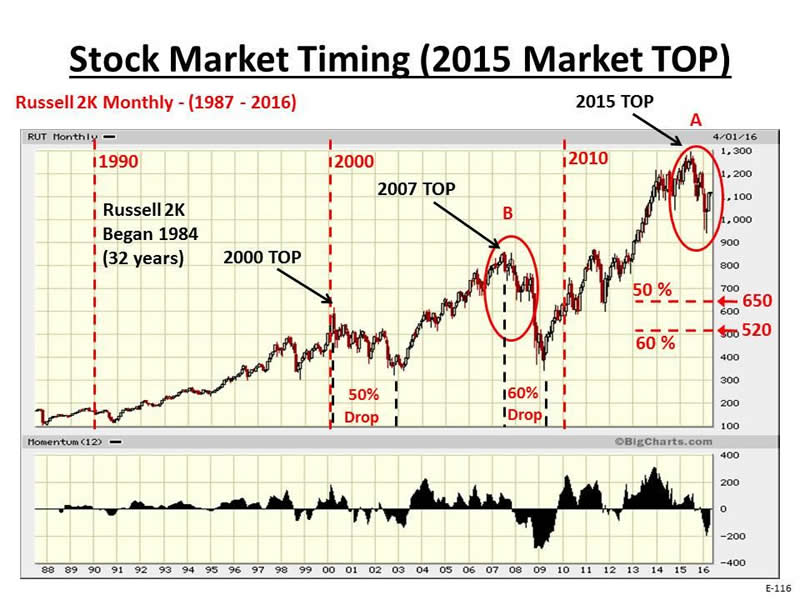
The question now is just how significant is this signal recorded by the Russell 2000 index. To answer this question we will now look at the chart below which shows a long term view of the Russell 2000 index.
The Russell 2000 was commissioned in 1984, some 32 years ago. The historic data used by the chart company here only goes back as far as 1987, so that is what is represented in the chart below.
We can see the red oval marked 'A' shows the 'phase 1' and 'phase 2' pattern shown in the charts above. The key point here is that in the 32 years of the Russell 2000 index this pattern has only been recorded once before and that was in early 2008 as shown by red oval 'B' on the chart below.
Also, it is important to note on the chart below that during the 2000-2002 downturn the Russell 2000 lost 50% of its value and during the 2007-2009 downturn the index lost 60% of its value. If we then project these same percentage pullbacks on to the chart for the recent high in 2015 (also anticipated to be a significant market top by the author) we can see the likely range that the Russell 2000 may drop down to, in the context of a bear market scenario. Hence, the index may revisit the 2011 or 2012 lows.
CONTINUED DOWNTURN FOR THE RUSSELL 2000
We now turn to look at an estimation of how long the Russell 2000 may continue to fall before a bottom is reached.
There is no guarantee that 'phase 3' will complete by recording all thirteen candlesticks that meet the rule, however, there is a chance that it might. In the case that it does complete then there needs to be a minimum of 13 monthly candlesticks to complete. Typically though a 'phase 3' segment might take up to 26 (double the minimum) candlesticks to complete. In this respect, we could see the Russell 2000 index pullback over a one to two year period during which 'phase 3' counts up thirteen monthly candlesticks that meet the rule.
In parallel with this analysis, there is evidence building that the DJIA (Dow Jones Industrial Average) index, which is now in an overbought state not seen since the US Great Depression (1929-1932), may take between two and three years to unwind and reach a final bottom. The DJIA has already fallen for 9 months since its all-time high on May 19, 2015.
CONCLUSIONS
A bear market signal has been recorded by the US Russell 2000 stock market index. The signal has only been seen once before in the 32 year history of the index, and that was back in early 2008 at the beginning of the recent and severe Great Recession bear market.
The fact that the signal has been recorded on the larger scale monthly chart means that the signal has greater significance than if it were seen on the daily or the weekly chart. Such downward momentum on the monthly chart indicates significant weakness.
Looking at both the Russell 2000 and the DJIA (Dow Jones Industrial Average) there is evidence building to suggest that this current downturn could be as equally severe as the recent Great Recession, with a period of 2 to 3 years elapsing before a bottom is reached. This would mean a bottom occurring somewhere in the period from approximately early Q3 2017 to late Q2 2018.
Disclosure: I/we have no positions in any stocks mentioned, and no plans to initiate any positions within the next 72 hours.
By Dr. David J. Harris
Disclosure: The author has no positions in any stocks mentioned, and no plans to initiate any positions within the next 72 hours.
David Harris is an independent stock market investor and trader with an interest in modeling price movements in stock markets. In particular, David has spent the last ten years developing mathematical models to identify market tops and market bottoms and more recently a model that identifies bubbles in national stock market indices and individual stocks. Trained originally as an Electronic Engineer, David has a First Class Honors Degree in Electronic and Electrical Engineering from Leeds University, UK and a PhD in Adaptive Control Algorithms, also from Leeds University. David has worked as a Senior IT Manager in the City of London and more recently in New York City for a variety of Investment Banks, including NatWest ...More Markets, Bankers Trust, Deutsche Bank, Bank of Bermuda and HSBC Bank.
© 2016 Copyright Dr. David J Harris - All Rights Reserved Disclaimer: The above is a matter of opinion provided for general information purposes only and is not intended as investment advice. Information and analysis above are derived from sources and utilising methods believed to be reliable, but we cannot accept responsibility for any losses you may incur as a result of this analysis. Individuals should consult with their personal financial advisors.
© 2005-2022 http://www.MarketOracle.co.uk - The Market Oracle is a FREE Daily Financial Markets Analysis & Forecasting online publication.