


Stock Market SPX Strength is Deceptive
Stock-Markets / Stock Markets 2016 Apr 03, 2016 - 10:22 PM GMTBy: Andre_Gratian

 Current Position of the Market
SPX Long-term trend: Severe correction underway
SPX Intermediate trend: Potential rally top.
Analysis of the short-term trend is done on a daily basis with the help of hourly charts. It is an important adjunct to the analysis of daily and weekly charts which discuss longer market trends.
Daily market analysis of the short term trend is reserved for subscribers. If you would like to sign up for a FREE 4-week trial period of daily comments, please let me know at ajg@cybertrails.com
SPX STRENGTH IS DECEPTIVE!
Market Overview
Three weeks ago: “If, however, as it is the case today, we are tracking an exceptionally strong counter-trend rally, we can assign a more liberal count to the trend and, in that case, we come up with 2058, 2070, and perhaps even 2080 before we reach a reversal point.”
The week before last, SPX reached a high of 2057 and had a 26-point pull-back before moving to 2072 last week, and retracing 23 points. It then rallied again to 2075 in the last hour on Friday, and closed at 2073. Are we done, or do we reach 2080, first? And do we go even higher?
My heading this week is: “SPX STRENGTH IS DECEPTIVE!” I will show you why later in this article, so I won’t discuss it just now. What I will say is, that although the SPX reached new highs last week -- something which had been forecast by the P&F projections stated above, using Janet Yellen’s dovish remarks last Tuesday as a catalyst to reach the final target – that is not the whole story! Relative weakness has continued to increase in some leading indicators and, as we will see in our analysis section, increased weakness is evident in the daily and hourly indicators of the SPX. There is too much correlation between these indicator patterns and short-term market tops for it to be ignored. It does not necessarily mean that the market will crash at the opening Monday morning, and we could even go on a little longer before reversing, but time is getting short and more price extension is less and less likely!
When we do reverse, we will need to see how much weakness occurs during the correction. A possible pattern would be that of a trading range until there has been enough distribution to suggest that a new low will be made in the primary downtrend. As I stated earlier, the index would have to surpass 2116, at a minimum, before we can consider turning long-term bullish again. And, the whole market would have to start looking bullish as well. Right now, it does not!
SPX Chart Analysis
Daily chart (This chart, and others below, are courtesy of QCharts.com.)
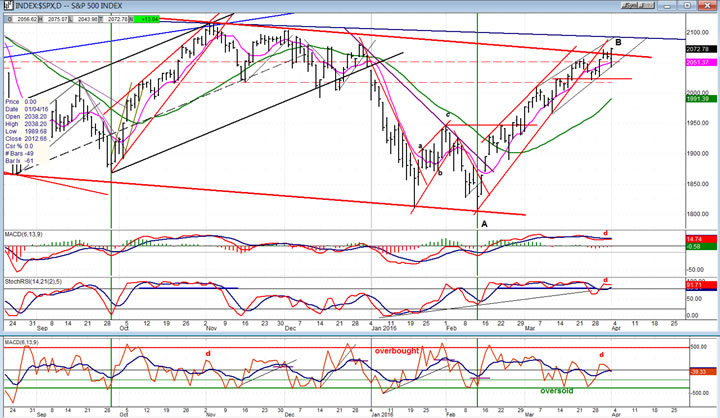
Last week, SPX started trading outside of its wedge pattern, but it was rescued by the Fed’s dovish tone concerning future interest rates and continued its climb outside of the broken trend line. That probably ends the close similarity that I had drawn between this rally and the one which also started from a double bottom in September. In spite of the altered look however, it still appears that we are forming a top. Considering the fact that all three indicators are showing negative divergence, one would have to assume that this uptrend is close to its last tick! As always, expectations have to be confirmed. In this case, the confirmation that we have a short-term top in place will come only when we drop below the short horizontal red line drawn at the 2020 level. At the same time, the indicators will have to give a conclusive sell signal.
Confirmation of an intermediate downtrend which would mark the top of B and the start of C would require even more weakness. We may not have to spend as much time at the top of the range as we did between November and January. There is already enough distribution showing in the 3X P&F chart above the 2020 level to suggest a retracement of a 100+ points. A few more reversals above that level would project an even longer decline; perhaps enough to drop below the 1810 low.
Hourly chart
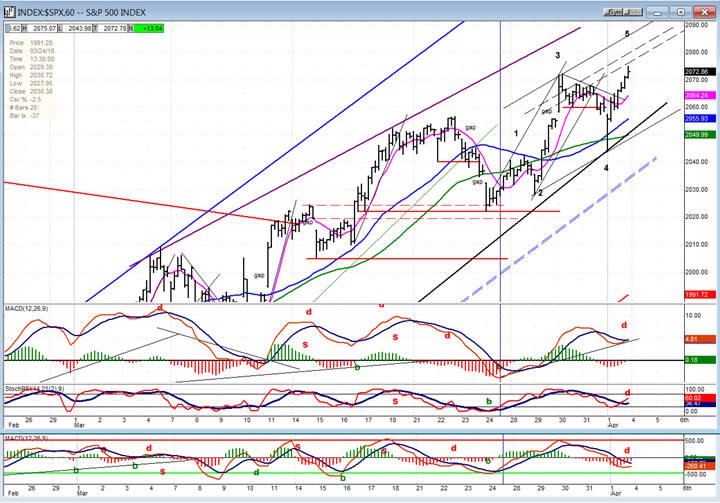
If you think that there was divergence on the daily chart, take a look at the indicators on the 60m chart! The new high at the close on Friday was greeted by only one bullish cross-over in the SRSI. The MACD did not quite make it, and the A/D indicator -- which is normally the first one to give a buy or sell signal -- shows the worse divergence of all.
That by itself would be enough to look at Friday’s new high with some suspicion but, structurally, it looks as if the corrective pattern from the 1810 low is ending (or about to end) with a 5-wave structure which started from the 2020 level and looks like a valid impulse wave. We also observe that wave 5 of this pattern is 1.50 the length of wave 1. In EW theory, there is very often a Fibonacci relationship between wave 1 and wave 5. Since, at Friday’s close, it looks as if there are only 3 waves in wave 5, we could extend the fifth wave to about 2077 to make it 1.618 relationship with wave 1. Or, we could end the move right here and skip the 5th wave -- an occurrence which is not uncommon.
Speculating about what the market will do using various methodologies is part of the fun and excitement of being a technical analyst -- as long as one doesn’t act on it until suspicions are confirmed.
- SPX et al…
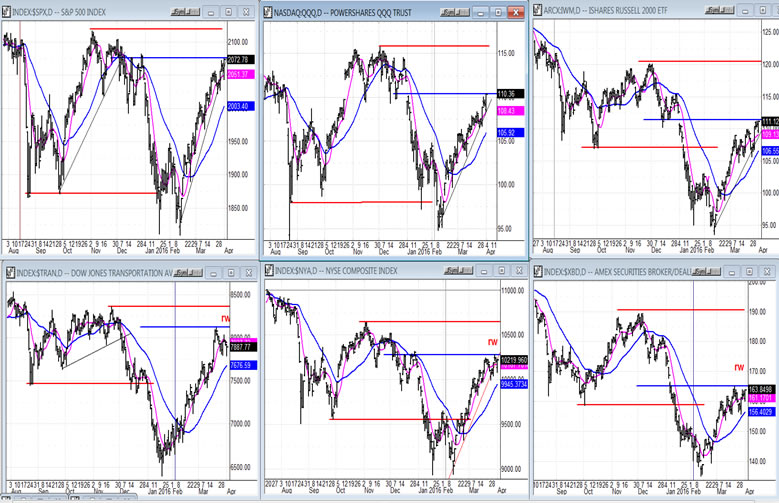
- The following shows the charts of 5 indexes which tend to lead the SPX (top left). The SPX does not always give a true representation of the entire stock market, and its current strength would be more credible if the following indexes were leading it on the upside, or were at least in sync with it, but they are not! On the contrary, they are all lagging the main index -- some by a considerable margin.
- The bottom red line represents the August/September low and the top red line, the November top. The blue line is at the level of last Friday’s high. This gives us a good representation of the relative position of each of the five leading indexes to that of the SPX. The top row made new near-term highs on Friday, along with SPX. In spite of this, you can see that, relatively speaking, these new highs are still far below their November tops, while SPX is very close to it. This is especially true of IWM which is one of the most reliable leading indexes.
- The bottom row are the indexes that not only diverge from SPX on a long-term basis, but failed to make new short-term highs along with it on Friday. And the biggest culprit is the TRAN which has given us reliable reversal warnings since the 2135 top. A special weakness award goes to XBD, whose current rally barely made it above its October low.
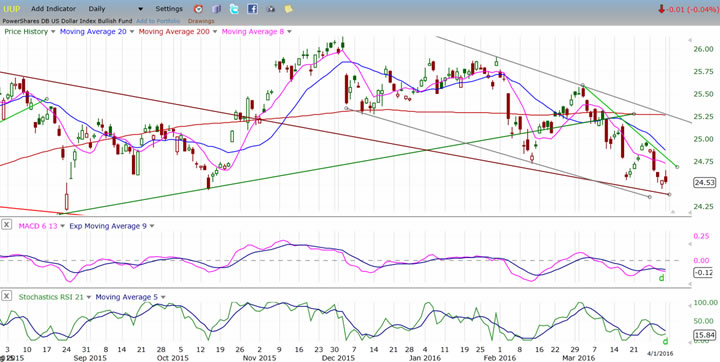
UUP (dollar ETF)
Janet’s comments did a job on the dollar! But it does not look fatal. There is some positive divergence in the indicators and I would not be surprised if UUP soon challenged its green short-term downtrend line, and even made it up to the top of the grey channel.
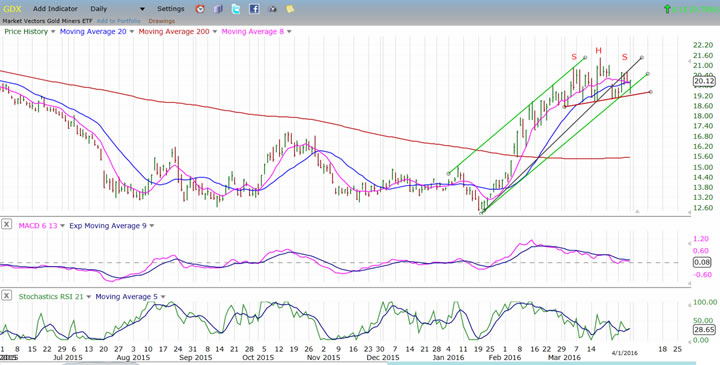
GDX (gold miners ETF)
This week, instead of showing GLD, I decided to analyze GDX. The H&S pattern which has formed in both is clearer to see on this index. We know that H&S patterns often fail, but in this case, there is a little extra insurance that it will prove to be valid: the 19-wk cycle is scheduled to bottom (ideally) in mid-April. When the neckline is broken, the index should decline down to the vicinity of the 200-dma, but this may come only after a quick retracement to the neckline. This price target is matched by the distribution count which has developed in the P&F chart on the right side of the head.
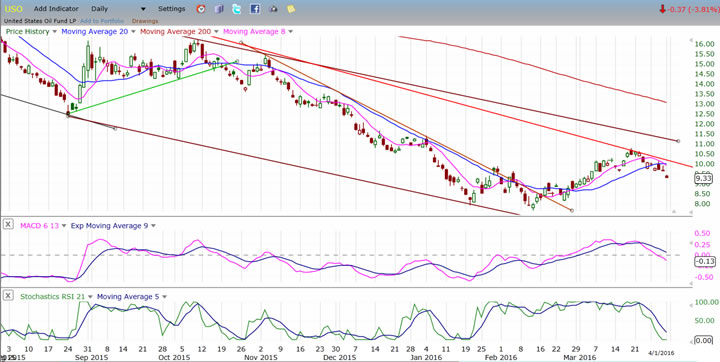
USO (US Oil Trust)
USO met its 10.50 count and has pulled back. There is no P&F target available to estimate the extent of the current decline, but the index has already almost retraced 50% of the distance from the 7.67 low to the 10.80 high. Since this is the first retracement after a major low, it may go lower in a re-test move. It’s true that oil producers are expected to meet on 4/17 in Qatar to discuss freezing current oil productions, but we’ll have to see if an agreement can be reached … and kept!
Summary
After reaching and pulling back from the two lowest top P&F projections, SPX may be trying for the third and last! Will it be a charm? In my analysis, I believe that I have made a strong case for an imminent top. Even if it is correct and the market does reverse from this level, we’ll have to see how much weakness does develop, and if it is enough to suggest that the primary trend has resumed.
There are two more observations that should be added to the above analysis: 1) Intermediate cycles strongly support a reversal at this time, and 2) the Greed & Fear index has entered the “Extreme Greed” phase! Consider this to be frosting on the cake!
Andre
FREE TRIAL SUBSCRIPTION
If precision in market timing for all time framesis something that you find important, you should
Consider taking a trial subscription to my service. It is free, and you will have four weeks to evaluate its worth. It embodies many years of research with the eventual goal of understanding as perfectly as possible how the market functions. I believe that I have achieved this goal.
For a FREE 4-week trial, Send an email to: info@marketurningpoints.com
For further subscription options, payment plans, and for important general information, I encourage
you to visit my website at www.marketurningpoints.com. It contains summaries of my background, my
investment and trading strategies, and my unique method of intra-day communication with
subscribers. I have also started an archive of former newsletters so that you can not only evaluate past performance, but also be aware of the increasing accuracy of forecasts.
Disclaimer - The above comments about the financial markets are based purely on what I consider to be sound technical analysis principles uncompromised by fundamental considerations. They represent my own opinion and are not meant to be construed as trading or investment advice, but are offered as an analytical point of view which might be of interest to those who follow stock market cycles and technical analysis.
Andre Gratian Archive |
© 2005-2022 http://www.MarketOracle.co.uk - The Market Oracle is a FREE Daily Financial Markets Analysis & Forecasting online publication.