


An More Accurate Measure of the Money Supply TMS or M3 ?
Economics / Money Supply Jul 14, 2008 - 06:16 PM GMTBy: Mike_Shedlock

 There has been an interesting discussion between Steve Saville and Paul van Eeden over the monetary aggregates M3 and TMS.
For those not familiar with TMS it stands for True Money Supply and it is a monetary measure based on Austrian economic principles. I will come back to the description of TMS in a moment but let's listen to a couple of discussion points from Steve Saville and Paul van Eeden first.
From Steve Saville in TMS or M3?
A few weeks ago Paul van Eeden (PVE) posted an extremely bearish outlook on bonds that he justified, in large part, by the rapid expansion of M3 money supply. We responded that while we are long-term bearish on bonds (we expect bond yields to move much higher over the coming 5 years), we thought that PVE's premise was wrong. Our reasoning: M3 is a poor indicator of monetary inflation, whereas a vastly superior monetary aggregate, namely the True Money Supply (TMS) developed by Murray Rothbard and Joseph Salerno, reveals a relatively slow rate of monetary inflation.
Paul van Eeden responded with a reply to Steve Saville - TMS or M3?
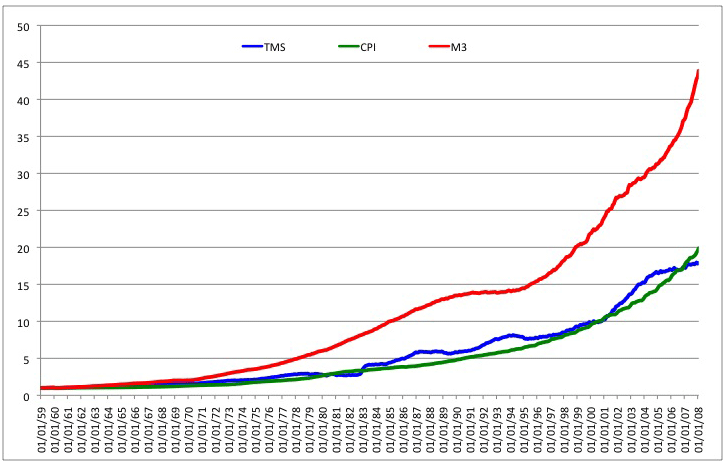
Paul posted several chart of M3 vs. TMS in relation to the CPI (defined as John Williams' estimate of the CPI) as his rebuttal.
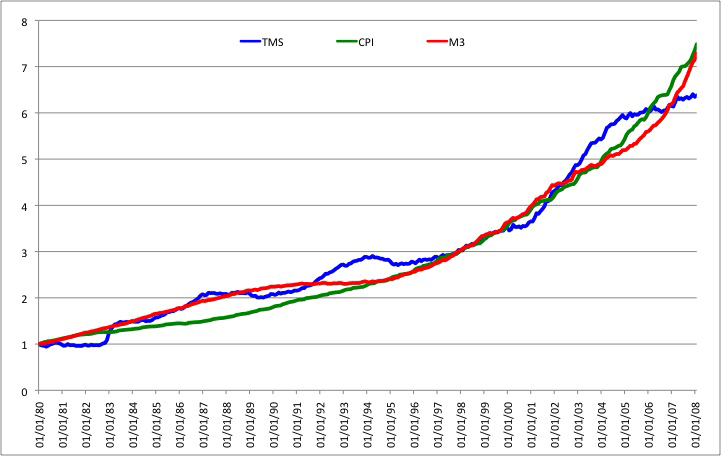
Interestingly, the first chart would appear to show the superiority of TMS. By picking a different starting time period, M3 tracks the CPI better than TMS as the second chart indicates.
M3, TMS, and the CPI 1959 to Present
M3, TMS, and the CPI 1980 to Present
OK but I have to ask: Of what practical use is tracking an estimated M3 vs. a nonstandard definition of the CPI?
I certainly see no reason to be shorting Treasuries based on that premise, as the following chart suggests.
10-Year Treasury Yields
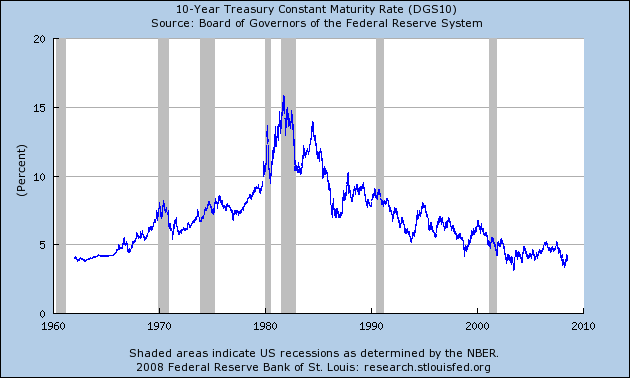
If M3 is such a good measure of inflation why did 10-year treasury yields collapse from 15% to 4%? And if one had shorted treasures in size in August of 2007 based on M3, that person would now be broke as short term rates collapsed from 5.25% to 2%.
Assuming (and to me it is a leap of faith) that M3 and the Williams CPI track, how does one take advantage of it? While M3 was sharply rising, gold was falling for decades along with treasury yields. Finally, I see absolutely nothing in those charts that makes M3 any kind of economic indicator.
M3 is soaring, we are clearly in a recession, and treasury yields have plunged over the last year. Which of those did M3 predict?
Why Is M3 Soaring?
People are failing to take into consideration why M3 is soaring. And right now the why is extremely important. The answer is businesses are tapping credit lines for fear they cannot tap them later. They are parking that money in institutional money market accounts and in response M3 and MZM have been soaring. These certainly are not inflationary conditions.
Indeed, Bank Credit Is Contracting .
Economist Paul Kasriel agrees. Kasriel is asking If the Fed Is So Easy, Why Is the Growth in Money and Credit Aggregates So Weak?
I am on record stating Peak Credit has arrived and Deflationary Hurricanes will Hit U.S. and U.K.
True Money Supply
The True Money Supply (TMS) was formulated by Murray Rothbard and represents the amount of money in the economy that is available for immediate use in exchange. It has been referred to in the past as the Austrian Money Supply, the Rothbard Money Supply and the True Money Supply.
For a detailed description and explanation of the TMS aggregate, see Salerno (1987) and Shostak The Mystery Of The Money Supply Definition (2000) .
The TMS consists of the following: Currency Component of M1, Total Checkable Deposits, Savings Deposits, U.S. Government Demand Deposits and Note Balances, Demand Deposits Due to Foreign Commercial Banks, and Demand Deposits Due to Foreign Official Institutions.
Note the above definition of what TMS consists of carefully.
Chart of TMS as of 2008-07-12
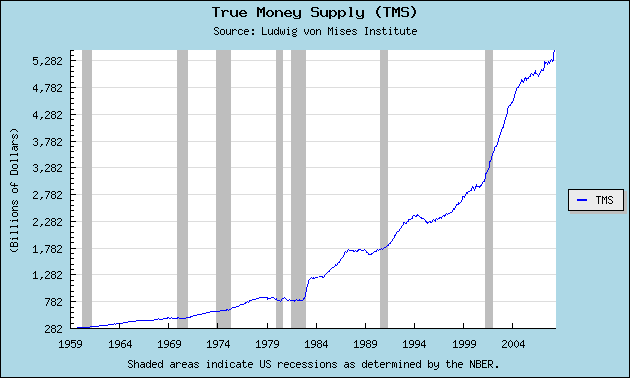
I have two problems with the above chart, both of them are serious. The first problem is the chart does not display TMS as Shostak defines it in The Mystery Of The Money Supply Definition :
Incorporating all the above arguments, the money supply is defined as follows: Cash+demand deposits with commercial banks and thrift institutions+government deposits with banks and the central bank.
Shostak rightfully excluded savings deposits because they are credit transactions (savings deposits are immediately lent out and are not really available on demand).
There is one other thing missing from the definition and that is sweeps. Inquiring minds will want to read Mystery of the Money Supply Definition for a complete discussion.
The second problem I have with the chart is the nature of the presentation. The best way to see what is happening is on a percentage change basis year over year. The Mises site does not offer that view.
M Prime
Using Shostak's definition and with much charting help from Bart at Now and Futures , I came up with M Prime (M'), arguably what TMS is supposed to be. For more details on the origin of M', please see Money Supply and Recessions .
Should Mises incorporate Shostak's definition and offer percentage changes, there will be no further need to publish M' updates.
M Prime 1968 To Present
M' dips below 2.5% or so are a strong signal of recession.
M3 1968 To Present
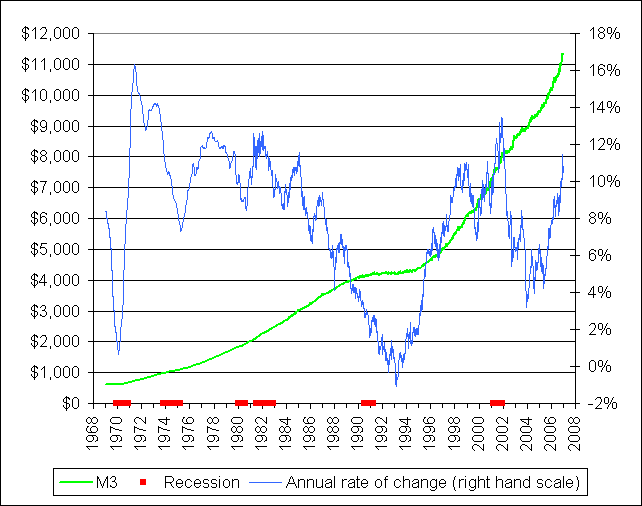
M3 is essentially useless in predicting recessions. Nor is it useful in predicting treasury rates or the price of gold. I can't find a single practical use for it. The amount of focus on an indicator so useless is staggering.
M Prime vs. TMS
TMS did a better job on a few earlier recessions but a worse in 1995 (non-recession), 2001, and now. I am sticking with M' for theoretical reasons. Shostak has this correct.
Synopsis
TMS and M' are clearly superior to M3 by any practical measure that I can come up with.
As for measuring inflation or deflation, I do not think any of them will suffice for the simple reason that credit marked to market is plunging and that is the way things need to be looked at. Unfortunately, there is no accurate measure of the plunge in credit because financial institutions are not marking credit to market. Instead much credit is still in SIVs and/or hidden in Level 3 (marked to fantasy) assets.
We can say that bank credit is shrinking, but we also know the numbers are distorted by off SIVs slowly coming back on bank balance sheets. That is on top of the distortion I mentioned earlier in that M3 and MZM are expanding because credit lines are being tapped and parked in money market funds.
Judging from collapsing real estate, people walking away from homes, risk aversion sinking in, and banks unwillingness to lend, together with the idea that credit that should be marked to market isn't, I believe we are in deflation, right here right now. Those focused on M3 or energy and food prices are truly missing the boat. Trillions of dollars of destruction in housing wealth (with much more coming) and another trillion markdown in bank credit coming (on top of what we have already seen) are far more important and far more representative of the state of affairs than is M3, or any other monetary aggregate for that matter.
By Mike "Mish" Shedlock
http://globaleconomicanalysis.blogspot.com
Click Here To Scroll Thru My Recent Post List
Mike Shedlock / Mish is a registered investment advisor representative for SitkaPacific Capital Management . Sitka Pacific is an asset management firm whose goal is strong performance and low volatility, regardless of market direction.
Visit Sitka Pacific's Account Management Page to learn more about wealth management and capital preservation strategies of Sitka Pacific.
I do weekly podcasts every Thursday on HoweStreet and a brief 7 minute segment on Saturday on CKNW AM 980 in Vancouver.
When not writing about stocks or the economy I spends a great deal of time on photography and in the garden. I have over 80 magazine and book cover credits. Some of my Wisconsin and gardening images can be seen at MichaelShedlock.com .
© 2008 Mike Shedlock, All Rights Reserved
Mike Shedlock Archive |
© 2005-2022 http://www.MarketOracle.co.uk - The Market Oracle is a FREE Daily Financial Markets Analysis & Forecasting online publication.