


Crowded Gold
Commodities / Gold and Silver 2016 Feb 29, 2016 - 06:32 PM GMTBy: Bob_Loukas

 Even though Gold did not continue higher this week, sentiment still seems to be dangerously elevated. Talk of $2,000 Gold and a new bull market has become common, and Gold seems ripe for a fall, at least in the short term. Don’t misinterpret my point – I see the evidence that a new bull market trend is developing, but that’s in the intermediate term. Shorter term, the current rally is approaching its limits.
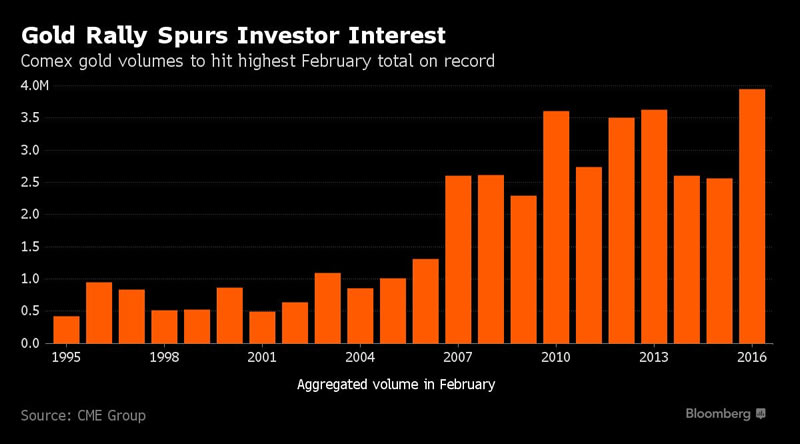
The average daily trading volume of call options for GLD, the SPDR Gold ETF, hit its highest level since 2011. But unlike today, 2011 Gold prices were at a record high. Turning to the Comex, Gold volume for February is about to surpass the levels of all past Februarys. And lastly, the volume in many precious metals Miners is through the roof, and the broader Gold mining indices have added more than 50% off their January lows.
The Gold bull market topped in 2011, and since then, the precious metals complex has been locked in a long, punishing decline as funds have flowed to greater opportunities. Long bear market declines are essentially an extended flow of capital out of an asset, which eventually bottoms when there are literally no more sellers at a greatly reduced price.
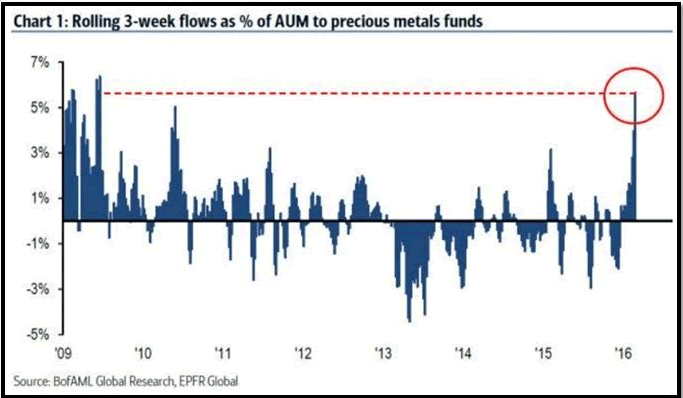
Of course there is no way to know with certainty whether Gold has bottomed yet. After 4 consecutive years without a significant counter-trend rally, we have to consider that the recent spike higher could be just a large bull trap. But regardless of whether Gold has seen a final bottom or not, I am encouraged by the large flow of capital back into the precious metals. Since all bear markets eventually end with a rushed inflow of new capital, the chart below is a good step toward confirming that the bear market is over.
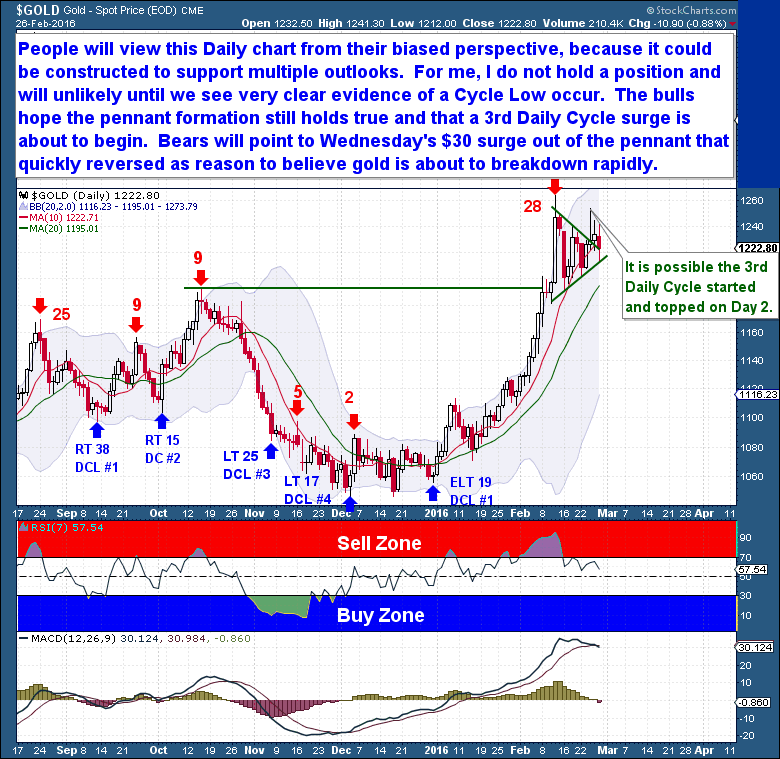
In the short-term, however, Gold is offering conflicting and difficult-to-read data. The Daily Cycle can be interpreted in multiple ways, and is likely to lead traders to construe the evidence to support whatever bias they hold.
I do not hold a position in Gold at present, and this allows me to be neutral in my analysis. As such, I see reasons that support being Long, and others that support the Short side. The bulls hope that the pennant – a continuation pattern – presages an imminent 3rd Daily Cycle surge that will take price to a new IC high. The bears, however, point to Wednesday’s reversal lower after a $30 surge higher from the pennant. Gold has again suckered the bulls, they believe, and is on the verge of breaking rapidly lower.
We know only one thing for certain – that Gold has rallied $150 in just a few short weeks. Any traders who rode all or most of the rise should be protecting profits now that the primary move higher is over. On the other hand, traders who only recently added Long positions in the hope of not missing another $100 rally are probably sitting in weak-handed positions. And these traders will likely bail at the first sign of downside. Netting it out, although another rally can always be coming, the potential reward is not high enough today to justify a Long position. The risk of a breakdown is simply too great. If you’re bullish, you need to be aware that Gold just formed its first bearish MACD crossed since October.
The primary reason for my concern about Gold, however, are the readings from various indicators that I use to spot tops. None of them are perfect, and none are exact timing tools, but all have proven their worth over time.
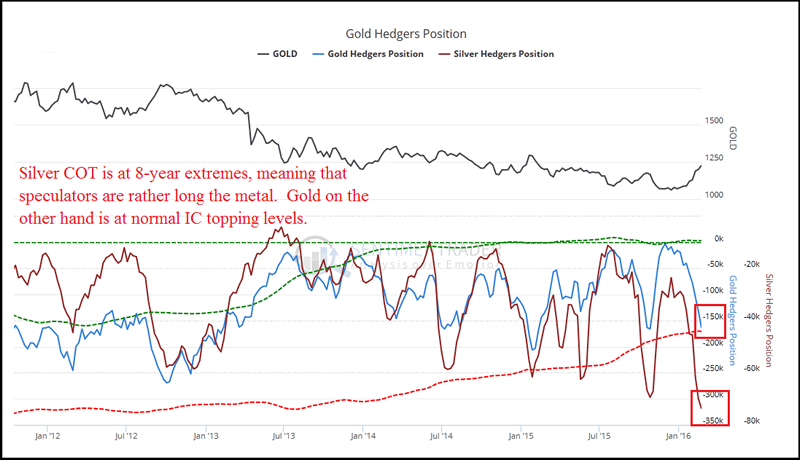
We’ve talked about these indicators before. The Silver COT has reached an 8-year high, an extreme level that underscores how Long speculators are in their positions. The Gold COT, however, is nowhere near as extreme as Silver, but is still at a level that is normally associated with an IC top. Turning to history, when compared with Gold’s nine previous Investor Cycles, the current IC is overdue for a top. Daily Cycle timing, too, is now in the latter part of the timing band for a DCL. So even though I am neutral, there is reason to believe that Gold could fall from here.
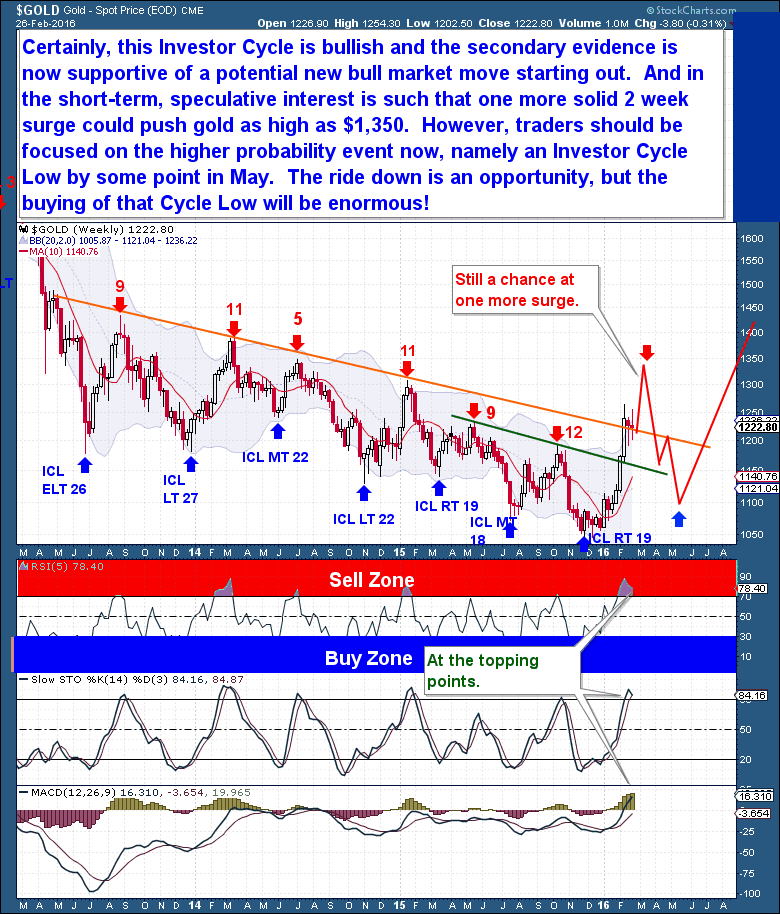
On the weekly chart, not much has changed since last week. And I suspect that it will continue to change little between now and next weekend, primarily because I see Gold’s IC topping in the very near future. In the short-term, however, speculative interest could push Gold as high as $1,350 in a final 2-week surge. Even though I’m not currently Long Gold, I would love to see such a move higher for several reasons.
The most obvious is that it would provide a very clear, valid reason to go Short. At that point – a week 15 high after a 25% gain – a selloff would be very likely. For decades, that sort of performance has preceded a sell-off.
In the longer term, and beyond the opportunity for a Short trade, such a move higher would have “bull market” written all over it. The precious metals Miners would likely be up 75% or more from their lows, just the sort of lockout move we’d expect from the first IC out of a bear market low.
Talk of a bull market is cheap, however, so we need to see Cycle evidence develop before we buy the bullish case completely. For now, traders should focus on the highest probability event, an Investor Cycle Low in May. This should provide Short opportunities in the near term, and Long opportunities after the bottom. In fact, the buying of the ICL should be enormous!
The Financial Tap publishes two member reports per week, a weekly premium report and a midweek market update report. The reports cover the movements and trading opportunities of the Gold, S&P, Oil, $USD, US Bond’s, and Natural Gas Cycles. Along with these reports, members enjoy access to two different portfolios and trade alerts. Both portfolios trade on varying time-frames (from days, weeks, to months), there is a portfolio to suit all member preferences.
You’re just 1 minute away from profitable trades! please visit: http://thefinancialtap.com
By Bob Loukas
© 2016 Copyright Bob Loukas - All Rights Reserved
Disclaimer: The above is a matter of opinion provided for general information purposes only and is not intended as investment advice. Information and analysis above are derived from sources and utilising methods believed to be reliable, but we cannot accept responsibility for any losses you may incur as a result of this analysis. Individuals should consult with their personal financial advisors.
© 2005-2022 http://www.MarketOracle.co.uk - The Market Oracle is a FREE Daily Financial Markets Analysis & Forecasting online publication.