


Gold, Gold Stocks, and the End Game
Commodities / Gold and Silver 2016 Feb 12, 2016 - 03:27 PM GMTBy: DeviantInvestor

 We have seen the bottom in the gold market and gold stocks.
Evidence:
- Examine the 30+ year chart of the monthly XAU (gold stock Index) to Gold ratio. You can see that the downtrend in the ratio has lasted about 20 years – since 1996. The ratio is now at all-time lows in the form of a contracting triangle. The triangle has been broken to the upside.
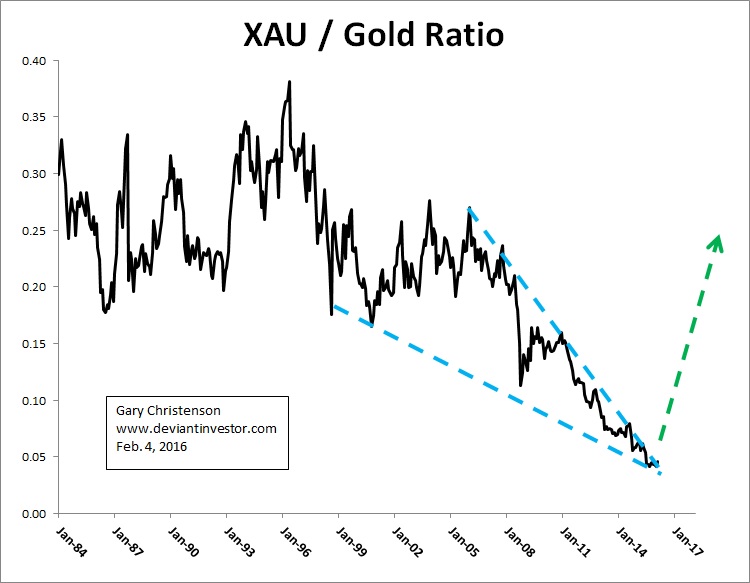
- In the last 20 years gold has moved upward from under $300 to $1,100 per ounce yet the XAU index has not kept pace, as shown by the ratio dropping from about 0.35 down to 0.03.
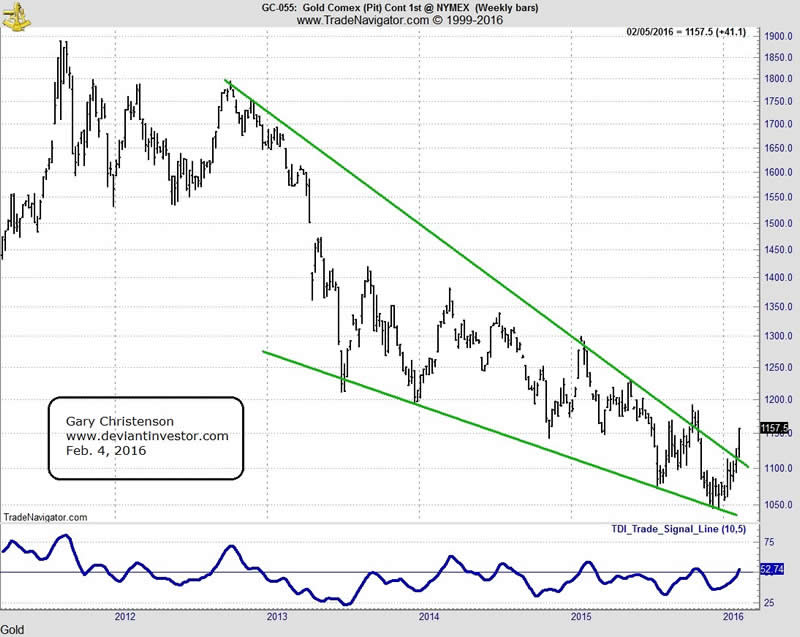
- Gold hit a multi-year low in December at about $1,045. As of February 11, about 1.5 months later gold prices have rallied off the lows by nearly $200 and gold has broken out to the upside.
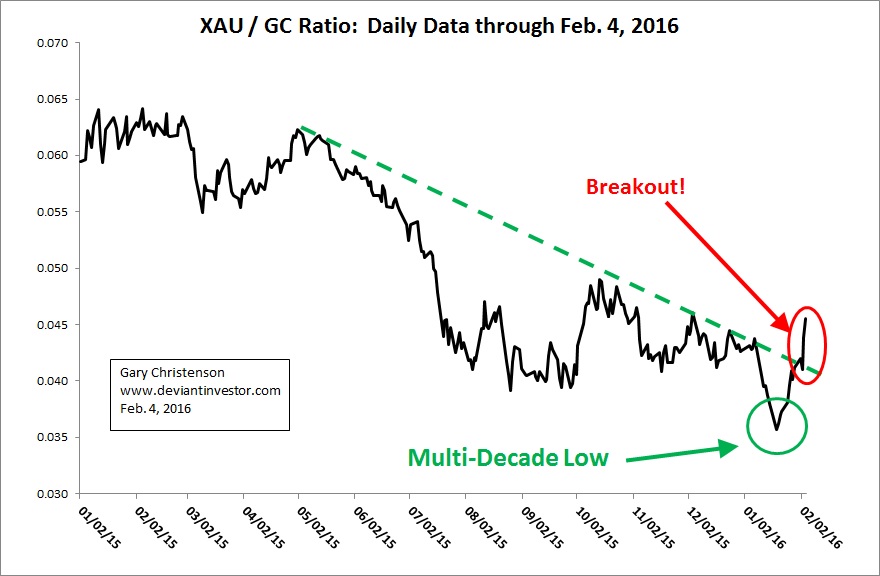
- The XAU to Gold ratio on a daily chart clearly shows a breakout to the upside. This indicates that the XAU is moving higher more rapidly than gold, a common indicator of gold market bottoms. Expect higher gold prices and much higher XAU prices.
- Another important ratio is the Gold to S&P 500 Index. The following chart shows 30+ years of Gold/S&P ratio and clearly shows a declining ratio from 1980 to about 2001, and a climbing ratio from 2001 thereafter. However, since 2011, the peak in gold prices, the ratio has collapsed back to 2007 levels. The next major moves should be up in gold and down in the S&P.
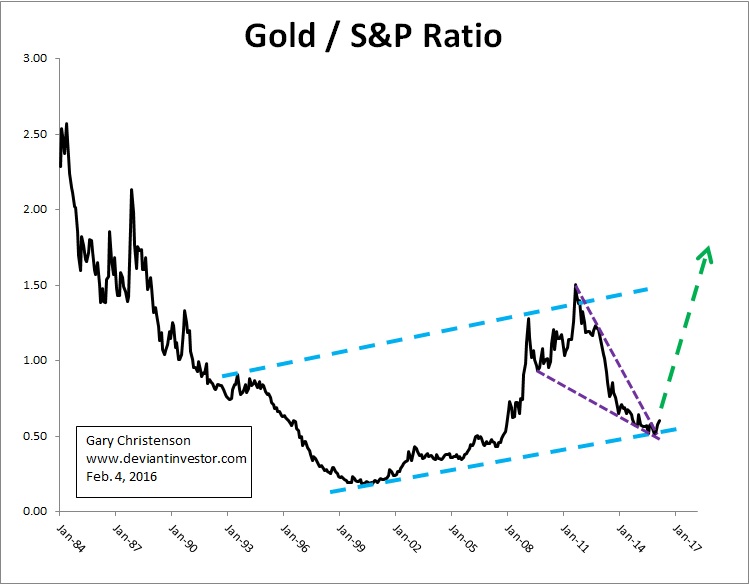
- The gold to S&P ratio shows the broad trend of investor preference. From 1980 to 2001 investors shunned gold and wanted paper – stocks and bonds, so the ratio declined. From 2001 to 2011 investors preferred gold and the ratio rose, but since 2011 bonds and stocks have moved higher and gold has fallen. The ratio shows a declining triangle that usually resolves with an upward movement. Expect higher gold prices and lower S&P prices.
A few questions:
- Would you prefer to own a bond that pays 6% per year guaranteed by a solid government with minimal debt, or gold which pays no interest and costs money to store it safely? Righto – most people would prefer the bond. But those days are long gone!
- Would you prefer to own a bond that extracts negative interest from your principal every year, locks up your capital for five years, and is guaranteed by an insolvent government with massive debt, slowly growing revenues, and rapidly growing expenses – or gold? Righto – gold looks better and better in an era of insolvent governments, zero or negative interest rates, bail-ins, and increasingly expensive and pervasive global wars.
- It is pretty clear that:
- Stocks (S&P, Dow, Nikkei, DAX, Shanghai etc.) are now in a period of declining prices, like 2008. (Look out below!)
- Bonds are nearing the end of a multi-decade bull market and can only be repaid by governments issuing new debt. (Not sustainable.)
- Gold and silver prices in the paper markets have been crushed for nearly five years and have recently broken out of declining triangle patterns. (Higher prices ahead!)
- The gold stock index (XAU) has fallen hard for 20 years and hit its lowest price ever (since 1984) in January, even lower than in the year 2000 when gold was under $300 per ounce. The capitulation crash has occurred and higher prices are ahead. (Finally!)
- If investors can get 8% yield from a safe bond they are likely to choose that bond instead of gold. But today the yield is next to nothing, and even negative for over $5 Trillion in bonds, gold has bottomed and will rally substantially 2016 – 2020. Eventually that realization will impact money managers, investors, and small investors. The Chinese and Russians already understand it!
CONCLUSIONS:
-
Gold prices have bottomed. The XAU index of gold stocks has bottomed.
- Central banks and politicians will talk, borrow, and spend but they will not save economies or protect your purchasing power. Gold and silver will protect your purchasing power and might help you sleep at night.
- Gold stocks will rally and are excellent speculations.
GE Christenson aka Deviant Investor If you would like to be updated on new blog posts, please subscribe to my RSS Feed or e-mail
© 2016 Copyright Deviant Investor - All Rights Reserved Disclaimer: The above is a matter of opinion provided for general information purposes only and is not intended as investment advice. Information and analysis above are derived from sources and utilising methods believed to be reliable, but we cannot accept responsibility for any losses you may incur as a result of this analysis. Individuals should consult with their personal financial advisors.
Deviant Investor Archive |
© 2005-2022 http://www.MarketOracle.co.uk - The Market Oracle is a FREE Daily Financial Markets Analysis & Forecasting online publication.