


The Stock Market Dow Elevator; 18, 17, 16....
Stock-Markets / Stock Markets 2016 Feb 12, 2016 - 12:48 PM GMTBy: Doug_Wakefield

 "Whatever the stock index, whatever the country, whatever the security, prices only rarely follow the predicted normal pattern. My student, Eugene Fama, investigated this for his doctoral thesis. Rather than examine the broad market index, he looked one by one at the thirty blue-chip stocks in the Dow. He found the same disturbing pattern; big price changes were far more common than the standard model allowed. Large changes, of more than five standard deviations from the average, happened two thousand times more often than expected. Under Gaussian rules, you should have encountered such drama only once every seven thousand years; in fact, the data showed, it happened once every three or four years." [The (Mis) Behavior of Markets (2004) World Renown mathematician Dr. Benoit Mandelbrot, pg 96]
Why are prices plummeting so severely globally? Why is the world acting in ways that don't fit the nice "moderate risk" box I thought I checked on my investment forms? I know, calmly ignore what is taking place in the financial markets, be confident markets will eventually settle down, and always know, that central bankers have my back......right?
Ten years ago this January, I released a research paper on short selling, well more like a book, titled, Riders on the Storm: Short Selling in Contrary Winds . That same month, I started my research newsletter on global markets, The Investor's Mind. I wrote the research paper not solely to focus on short selling, but the need to think outside the conventional financial box, especially in a world with a long history of financial booms and busts that has widely embraced the modern Keynesian model of "unlimited debt" and intervention by central banks.
Now I ask you with what we are watching this year, was I really being conceited when I turned away from financial models and theories I was taught by the financial planning industry in search for other ideas?
"Consider these words from the College for Financial Planning Investments Textbook 7th Edition:
'Perhaps it is conceit that makes some individuals think they can use the dividend-growth model or P/E ratios or price-to-book ratios or any other technique to beat the market.'" [Riders on the Storm: Short Selling in Contrary Winds (2006) Wakefield/Hill, page 30]
I have learned so much from many great market technicians since 2005. Yet the same investment textbook had this to say about technical analysis.
"The results of these studies strongly suggest that technical analysis does not lead to superior investment results. However, this lack of empirical support has not stopped the use of technical analysis, and some of its jargon is commonly used by both professional and lay investors." [Ibid, pg 437, Chapter on Technical Analysis]
If the focus is solely beating the ultra cheap credit, state assisted boom, I would tend to agree, unless of course, one had bought the FANG group or leveraged the NASDAQ to the hilt. However, if cheap credit booms have continued to end in very destructive busts, I can think of plenty of reasons investors would not desire to ride full throttle down through the latest "largest bust in history".
As merely one technical view on markets, I would encourage anyone, whether investor, advisor, or manager, to check out these two charts, just released by Chris Kimble of Kimble Charting solution, an individual who has charted these roller coaster markets for decades.
For a larger view of the chart below, click this link directly to Kimble's site .
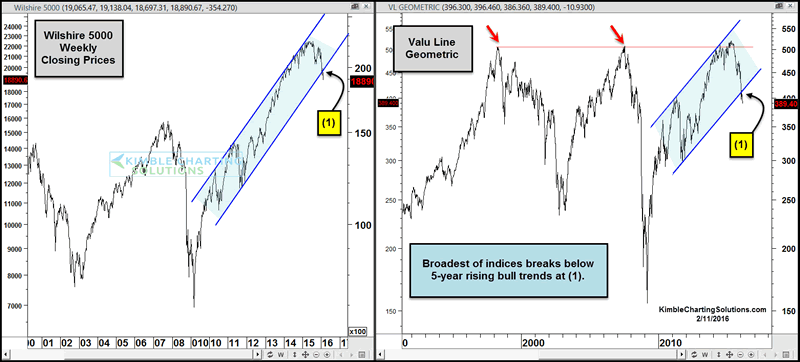
What is taking place right before our eyes is not merely another boom that is going bust. It is also another wakeup call to everyone, that without an understanding of the history underneath these massive rises and falls, trusting any theory is totally irrelevant.
Pressure Points Matter
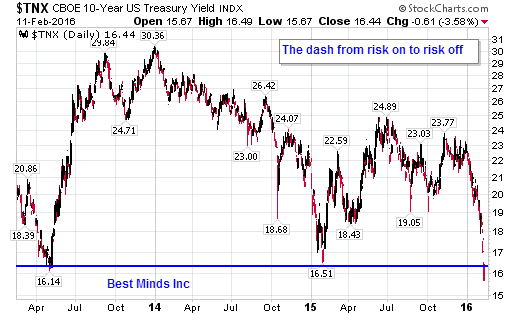
So leaving the world of theories that are breaking down, and focusing instead on markets breaking down or up, let's review some pressure points.
As we can see, money has been pouring into Treasuries (yield plunging) and out of stocks.
For anyone who watched the movie, the Big Short, or read Michael Lewis' book, knows that credit default swaps were the ultimate bet against the subprime bubble that was built going into 2008.
"By the end of 2006, according to PerTrac Hedge Fund Database Study, there were 13,675 hedge funds reporting different results, and thousands of other types of institutional investors allowed to invest in credit default swaps....
A small number of people - more than ten, fewer than twenty - made a straightforward bet against the entire multi-trillion-dollar subprime mortgage market and, by extension, the global financial system. In and of itself, it was a remarkable fact: The catastrophe was foreseeable, but only a handful noticed." [The Big Short: Inside the Doomsday Machine (2014) Michael Lewis, pg 104 & 105]
If The Big Short is a piece of financial history leading up and through the Great Recession, what do these charts of credit default swaps tell us today?
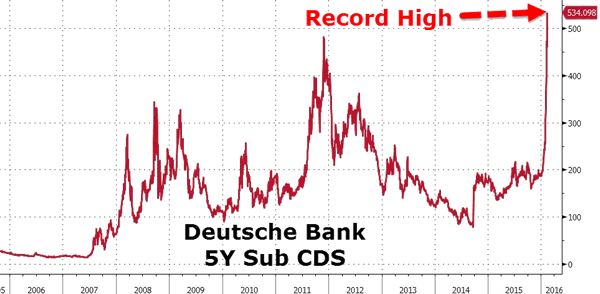
Source: Zero Hedge , 2/11/16
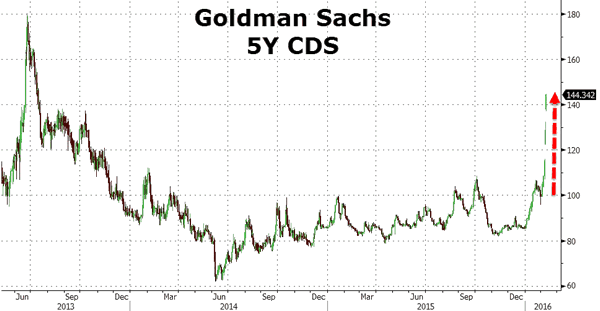
Source: Zero Hedge , 2/9/16]
A similar chart of credit default swaps on Glencore was seen last fall on September 28th right around the time US stocks bottomed. With 2016 increasing tensions across the global financial system, we need to remember the old saying, "history does not repeat itself, but it does rhyme". In other words, while we certainly could still bounce from these levels, what has changed since last fall?
What Has Changed Since Last Fall?
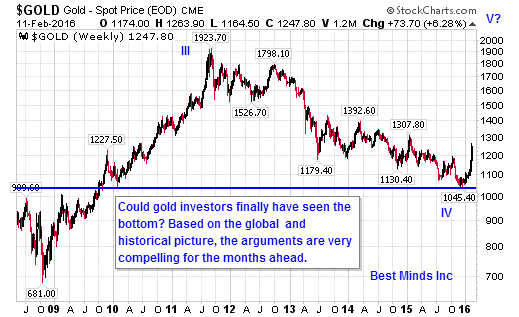
Gold has finally broken above its 200 day moving average and climbed hard for 7 days after doing so. The US dollar (DXY), after reaching its 12 year high of 100 last spring and stopping at the same area in early December, is once again back under its 200 day moving average. The Yen, after stopping at the same resistance level for 14 months, has broken this level and climbed all week. China's Hang Seng index dropped 742 points (3.85%) on Thursday after being closed for 3 days for the start of the Chinese Lunar New Year. Today's low was the lowest this year, and its close was 10,000 points lower than its April 2015 top.
The German DAX bounced with the Dow and S&P 500 on January 20th, but since has rolled over and today closed almost 600 points below that low. The Japanese Nikkei closed almost 300 points below its January 21st low yesterday before being closed today for National Founding Day. Thursday evening and the Nikkei has fallen another 700 points to break 15,000 before recovering. As of Thursday evening, it is now over 5,000 points lower than its 20,012 close on December 1st.
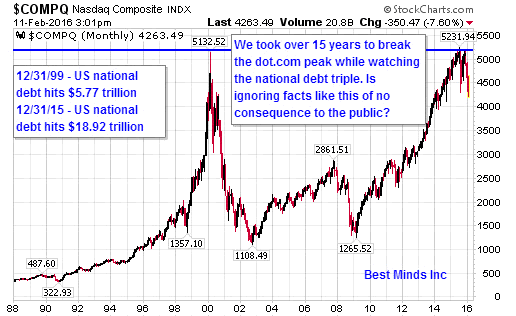
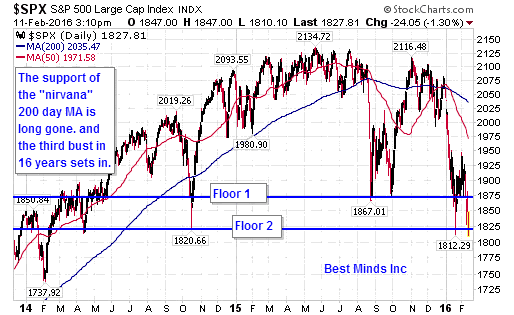
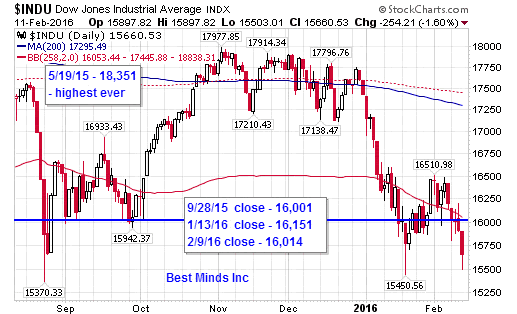
So with central bankers not being able to get a big rally going globally, and "big money" producing quick but unsustainable rallies in US stocks, we are reaching a point where at some point, the Dow 16,000 becomes rear view mirror material.
Remember Dow 18,000? The last time the Dow closed above this level was July 20, 2015. How about 17,000? January 5th. 16,000? Currently February 9th.
On January 13th the Dow closed at 16,151 and on February 9th, 4 weeks later it closed at 16,014. Months from now everyone will know what was the last 16,000 close coming off the top of the bubble. However, at the speed of destruction we are all watching, time is not on the side of the "wait and see" group.
If there is anything that can be thrown at US markets to keep them afloat through February monthly options expiration next Friday, it better start soon, and I don't think talk about negative interest rates will do the trick based on what we have watched in the last 4 weeks.

So while markets are very stretched, the knives keep falling and no one seems to be able to convince the herd of a sustainable reason to dive in at these price levels.
Every conventional investor must now ask themselves, what floor are they going to get off the elevator?
Be a Contrarian, Remember Your History
If you are reading this article, you are already aware of the trillions that have been lost in the last 9 months. It is very clear to anyone paying attention to "the game", that the number of critical pressure points continues to rise.
Click here to start the next six months reading the paid research found in The Investor’s Mind newsletters and ongoing brief market emails as we continue through this highly volatile year.
Doug Wakefield
President
Best Minds Inc. a Registered Investment Advisor
1104 Indian Ridge
Denton, Texas 76205
http://www.bestmindsinc.com/
doug@bestmindsinc.com
Phone - (940) 591 - 3000
Best Minds, Inc is a registered investment advisor that looks to the best minds in the world of finance and economics to seek a direction for our clients. To be a true advocate to our clients, we have found it necessary to go well beyond the norms in financial planning today. We are avid readers. In our study of the markets, we research general history, financial and economic history, fundamental and technical analysis, and mass and individual psychology
Doug Wakefield Archive |
© 2005-2022 http://www.MarketOracle.co.uk - The Market Oracle is a FREE Daily Financial Markets Analysis & Forecasting online publication.