


Stock Market Volatility Index Funny Business
Stock-Markets / Stock Markets 2016 Jan 29, 2016 - 08:49 PM GMTBy: Barry_M_Ferguson

The volatility index, or the VIX, is commonly thought to be an index that gauges index volatility. Actually, the VIX is an index that gauges the expense of put options. Put options of course are designed to gain advantage when the underlying asset declines in price. In this case, the VIX is a measure of the expense of buying put options on the S&P 500 index. Normally, prices are set by buyers and sellers. More buyers than sellers generally leads to higher prices and fewer buyers than sellers generally leads to lower prices. Normally.
But we aren’t in Kansas anymore. There is also a ratio that we can follow comparing puts and calls. This is the ‘put-call ratio’. A ratio of ‘1’ would indicate that there are an even number of puts and calls sold on a given day. Less than one indicates more ‘call’ buyers and a ratio above one indicates more ‘put’ buyers. The price should of course follow. Unless, there is some funny business going on in the options carnival.
Let’s look at a 3 month chart of the S&P 500 in gold, the VIX in black, and the ‘put call ratio’ in red all on the chart below. Clearly this is a very short term chart (3 months) but we can see that the price of options (VIX) pretty well mirrors the ratio of puts and calls sold. That seems logical.
However, something funny is going on. Not in a humorous way but in a fraudulent way. Typically, and logically, when the S&P 500 index sells off, put options are a popular way for investors to protect against further downside risk. Thus, when the stock index falls, the put-call ratio increases and so too does the price of those put options (VIX).
But look what happened in January of 2016. Stocks sold off immediately due to the Federal Reserve’s respite from daily stock price support in Q4 of 2015. As the Fed usually takes the first few weeks of January off, asset prices decline. Who could predict that? Our logic so far is working. Down went the S&P index. Up went the VIX and the put-call ratio (as represented by CPCE or the red line). Then things got a little funny in the third week of January.
The S&P index sold off some 8% or so in the first two weeks of the month. Right on cue, our VIX, or the price of put options, went up. However, the put call ratio fell right along with the stock index. As stocks tanked, more call options were sold than put options. Yet, put options increased in price? Yes, notice the divergence of the red line and the black line.
Thus we must ask the question. Who has been buying all these call options while faced with a declining stock index?
Given central bankers everywhere are propping up stock indices, or trying to mute the decline of stock indices, should we assume the Federal Reserve Bank is at work in the shadows? See the chart below. Notice the funny business from the 19th of January to the present. Wouldn’t it be nice to be free from central banker dominance? What we do know is the red line and the black line will soon get back together. Or, if the stock indices resume their bearish trend, the central bankers will have to let them by refraining from call option purchases. And, just as predictable, when a stock index is down hard in the first few weeks of the month, there is always a rally at the end of the month. Why? Investors get a monthly statement and the central banksters don’t want investors to get discouraged. So, they escalate the balloon. See the chart for funny business at work.
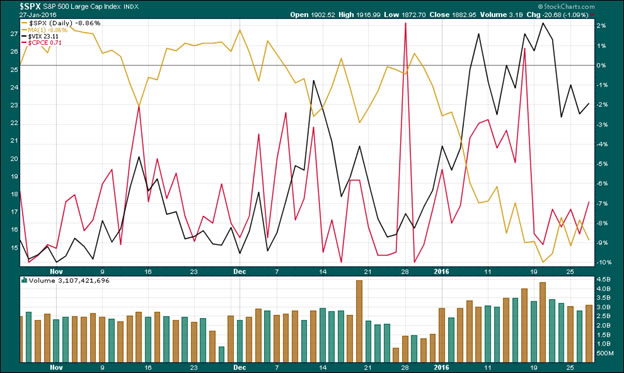
Chart courtesy StockCharts.com
Barry M. Ferguson, RFC
President, BMF Investments, Inc.
Primary Tel: 704.563.2960
Other Tel: 866.264.4980
Industry: Investment Advisory
barry@bmfinvest.com
www.bmfinvest.com
www.bmfinvest.blogspot.com
Barry M. Ferguson, RFC is President and founder of BMF Investments, Inc. - a fee-based Investment Advisor in Charlotte, NC. He manages several different portfolios that are designed to be market driven and actively managed. Barry shares his unique perspective through his irreverent and very popular newsletter, Barry’s Bulls, authored the book, Navigating the Mind Fields of Investing Money, lectures on investing, and contributes investment articles to various professional publications. He is a member of the International Association of Registered Financial Consultants, the International Speakers Network, and was presented with the prestigious Cato Award for Distinguished Journalism in the Field of Financial Services in 2009.
© 2016 Copyright BMF Investments, Inc. - All Rights Reserved
Disclaimer: The views discussed in this article are solely the opinion of the writer and have been presented for educational purposes. They are not meant to serve as individual investment advice and should not be taken as such. This is not a solicitation to buy or sell anything. Readers should consult their registered financial representative to determine the suitability of any investment strategies undertaken or implemented.
© 2005-2022 http://www.MarketOracle.co.uk - The Market Oracle is a FREE Daily Financial Markets Analysis & Forecasting online publication.