


First Uptrend of Stocks Bear Market
Stock-Markets / Stocks Bear Market Jan 24, 2016 - 03:56 AM GMTBy: Tony_Caldaro

 The week started off at SPX 1880. After a Monday holiday the market gapped up to SPX 1901 on Tuesday, and then immediately headed lower. On Wednesday the market gapped down at the open, hit a new low for the downtrend at SPX 1812, and then began to rally. The rally continued through Thursday and Friday with the SPX clearing 1900, and ending the week at 1907. For the week the SPX/DOW gained 1.05%, the NDX/NAZ gained 2.60%, and the DJ World gained 0.90%. Economic reports for the week were mostly negative. On the uptick: existing homes sales and the Q4 GDP estimate. On the downtick: the NAHB, CPI, housing starts, building permits, leading indicators, the WLEI, the Philly FED, plus weekly jobless claims rose. Next week the FED meets Tuesday and Wednesday, and we get our first look at Q4 GDP.
LONG TERM: bear market
After a six year bull market it can be difficult to accept that we are now in a bear market. The market is being accommodative, as it has risen 1.4% since the bear market was confirmed a week ago Friday. This week we start off with the SPX monthly chart.
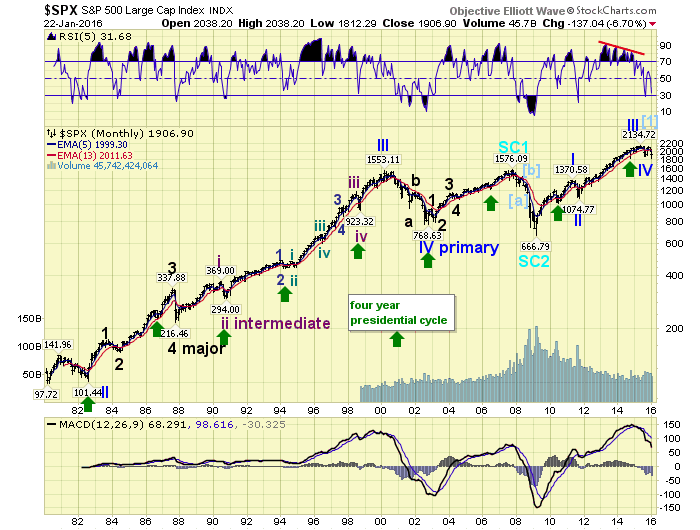
With the last three bull markets being three of the five longest bull markets in history it is a good place to make a technical point. The last five bull markets, the first two were short, are displayed on the chart: 1982-1983, 1984-1987, 1987-2000, 2002-2007 and 2009-2015. Notice the action in the RSI. During 1982-1983: the RSI got oversold only in the 1984 bear market. During 1984-1987: the RSI got oversold only during the 1987 crash. During 2002-2007: the RSI got oversold only during the 2007-2009 bear market. During the lengthy 1987-2000 bull market, the RSI got oversold twice: the 1990 and 1998 corrections. During the recent 2009-2015 bull market, the RSI got oversold twice again: the 2011 and 2015 primary waves. Now after rising back up during primary V, it is heading lower again with the bear market underway. A simple chart with a really good Fibonacci indicator.
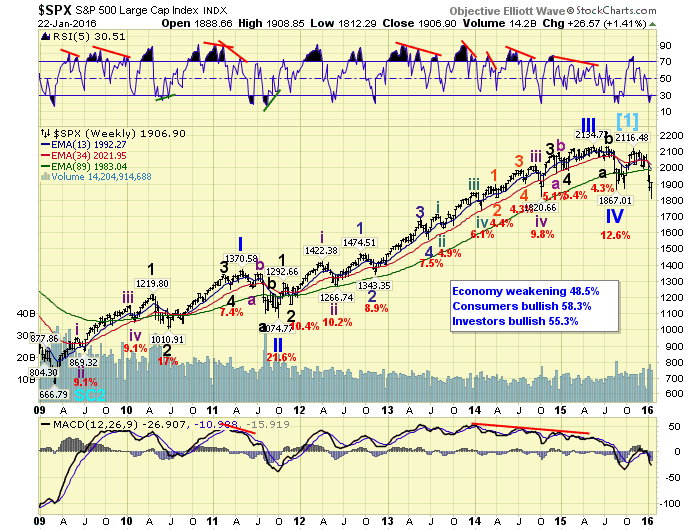
The weekly chart displays the entire five Primary wave bull market, and just the early weeks of the new bear market. Primary waves I and II completed in 2011, and Primary waves III, IV and V completed in 2015. Since Primary V failed to make a new high, which we call a fifth wave failure, there must be something negative getting underway in the world’s economy.
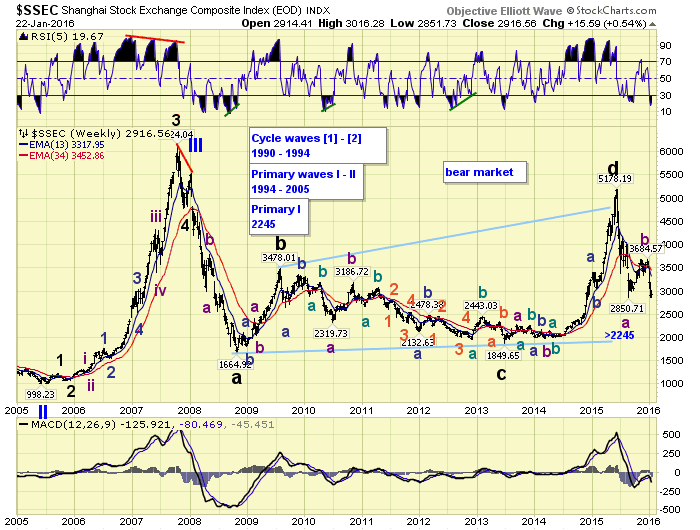
Fifth wave failures of this degree, in the US, are so rare I do not recall ever seeing one. However, I might add, China’s SSEC experienced a fifth wave failure of one lesser degree in early 2008. This was an omen of the 2008 melt down. The fifth wave failure in the US may be an omen of another meltdown yet to come. As we have noted for several months, starting in October, it is time to prepare for a bear market.
MEDIUM TERM: potential uptrend underway
After the Primary IV low at SPX 1867 in August, Primary V kicked off in a somewhat choppy fashion. Major wave 1 rallied to SPX 1993, and was followed by an irregular zigzag Minor wave 2: 1903-2021-1872. After that Major wave 3 was quite a rally, hitting SPX 2116, for a 13% gain, in just 5 weeks. Then after an anticipated Major wave 4 to SPX 2019, Major wave 5 simply ran out upside momentum in its effort to make new highs. Not only did Primary V fail to make new highs. Major wave 5 also failed to make a high higher, and Intermediate wave v ended abruptly in a diagonal triangle. We could call this a triple failed top at SPX 2104, about 1.5% from the all time high.
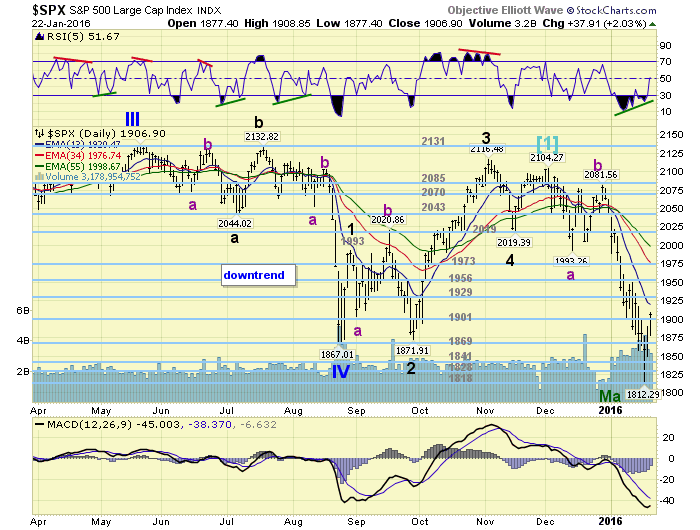
The first decline from SPX 2104 was a complex three back to 1993 (high of Major 1). Then after a simple a-b-c rally to SPX 2082, the market headed sharply lower in another complex three down to SPX 1812. A level not seen since Q1 2014. At that low, which occurred on Wednesday, the market set up a positive daily RSI divergence from an extremely oversold condition and started to rally. In fact, using some metrics, the most oversold condition since the last bear market. We have labeled this low as a potential completed Major wave a, the first downtrend of the bear market. Medium term support is at the 1901 and 1869 pivots, with resistance at the 1929 and 1956 pivots.
SHORT TERM
If the downtrend actually completed at that low we have an a-b-c decline from SPX 2104-1812 to start the bear market, and this is labeled Major wave A. The current potential uptrend should also be an a-b-c, and will be labeled Major wave B. What would follow then is an equal, or nastier, downtrend for Major wave C, to complete Primary wave A of Cycle [2].
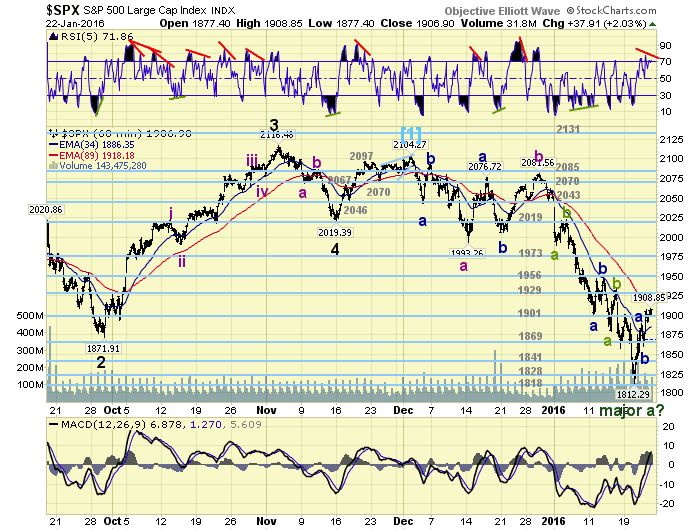
Thus far the uptrend also looks corrective, as it should. We have observed a double three rally to SPX 1890, a pullback to SPX 1860, and now an ongoing rally to SPX 1908. We are labeling the first high Minor a, the pullback Minor b, and the current rally Minor c of Intermediate A. Then after an Intermediate wave B pullback, the market should do another Minor a-b-c to complete Major wave B. Now for some calculations.
Minor wave a was 78 points (1812-1890), and Minor b bottomed at 1860. If Minor c is 0.618 Minor a it already topped at SPX 1908. If it equals Minor a it should continue higher to SPX 1938. SPX 1908 falls within the range of the 1901 pivot, and SPX 1938 is just above the range of the 1929 pivot. If Crude continues its rally into Monday we are likely to see the higher target. Wherever it tops Intermediate wave B should find support around SPX 1860 (the 1869 pivot). Then Intermediate C should kick in for another rally.
Fibonacci retracements for all of Major wave B suggest three areas: SPX 1928 (38.2%), SPX 1964 (50.0%), and SPX 2000 (61.8%). Also when it does top I would expect the daily RSI to get overbought. Overall, this should be the last decent chance to exit or hedge equities for the next year to two years. Short term support is at the 1901 and 1869 pivots, with resistance at the 1929 and 1956 pivots. Short term momentum is beginning to display a negative divergence. Best to your trading this volatile market!
FOREIGN MARKETS
Asian markets were mixed on the week and lost 0.7%.
European markets were mostly higher and gained 1.0%.
The Commodity equity group were mostly higher and gained 2.4%.
The DJ World index may be in an uptrend and gained 0.9%.
COMMODITIES
Bonds are uptrending but lost 0.1%.
Crude is downtrending but gained 5.1%.
Gold is uptrending and gained 0.9%.
The USD looks to be uptrending and gained 0.6%.
NEXT WEEK
Tuesday: Case-Shiller, FHFA housing and Consumer confidence. Wednesday: New home sales and the FOMC meeting concludes. Thursday: weekly Jobless claims, Durable goods, and Pending home sales. Friday: Q4 GDP (est. +0.8%), the Chicago PMI and Consumer sentiment. Best to your weekend and week!
CHARTS: http://stockcharts.com/public/1269446/tenpp
After about 40 years of investing in the markets one learns that the markets are constantly changing, not only in price, but in what drives the markets. In the 1960s, the Nifty Fifty were the leaders of the stock market. In the 1970s, stock selection using Technical Analysis was important, as the market stayed with a trading range for the entire decade. In the 1980s, the market finally broke out of it doldrums, as the DOW broke through 1100 in 1982, and launched the greatest bull market on record.
Sharing is an important aspect of a life. Over 100 people have joined our group, from all walks of life, covering twenty three countries across the globe. It's been the most fun I have ever had in the market. Sharing uncommon knowledge, with investors. In hope of aiding them in finding their financial independence.
Copyright © 2016 Tony Caldaro - All Rights Reserved Disclaimer: The above is a matter of opinion provided for general information purposes only and is not intended as investment advice. Information and analysis above are derived from sources and utilising methods believed to be reliable, but we cannot accept responsibility for any losses you may incur as a result of this analysis. Individuals should consult with their personal financial advisors.
Tony Caldaro Archive |
© 2005-2022 http://www.MarketOracle.co.uk - The Market Oracle is a FREE Daily Financial Markets Analysis & Forecasting online publication.