


Stock Market Swing Baby, Swing!
Stock-Markets / Stock Markets 2016 Jan 22, 2016 - 05:13 PM GMTBy: Gary_Tanashian

 This article assumes one is trading the up and down swings in the stock market. Swing traders are just one segment of a market population that includes those sitting in cash (and/or risk ‘off’ vehicles like Treasury Bonds), maintaining longer-term short positions, our always bullish friends, the “stocks for the long-term” contingent and of course, the indomitable Gold Bug “community”, focusing as ever on one asset class while a world full of other assets is in motion.
“Let’s go let’s go, he’s no batter, he’s no batter… (pitch comes to the plate) SWING BATTER!!!”
That was the exact line we were coached to use in little league. Picture it, eight kids out there on every pitch taunting the kid at bat with with a canned line in high pitched, pre-pubescent voices. Yeh, that was intimidating.
Here in the all grown up world of the stock market we need the same consistency, although the timing of a “Swing” command is much more exacting. With market volatility what it has been, you’d have to get lucky to call (to the day, let alone hour or minute) the exact bottom or top to any bear or bull swing in the markets. Indeed, I have been expecting a short-term bottom for a while now, initiating a long position on SPY last week (and adding to it this week), but only adding more long positions (and covering some shorts) over the last two days.
So what is a market swing? It is a lurch in the bullish or bearish direction within a trend. It is important to know that the bull bounce (swing) we have been managing is within a bear trend now, so bull positions, assuming a bounce manifests, should be considered temporary.
Below we review the S&P 500 from the perspective of daily and weekly time frames.
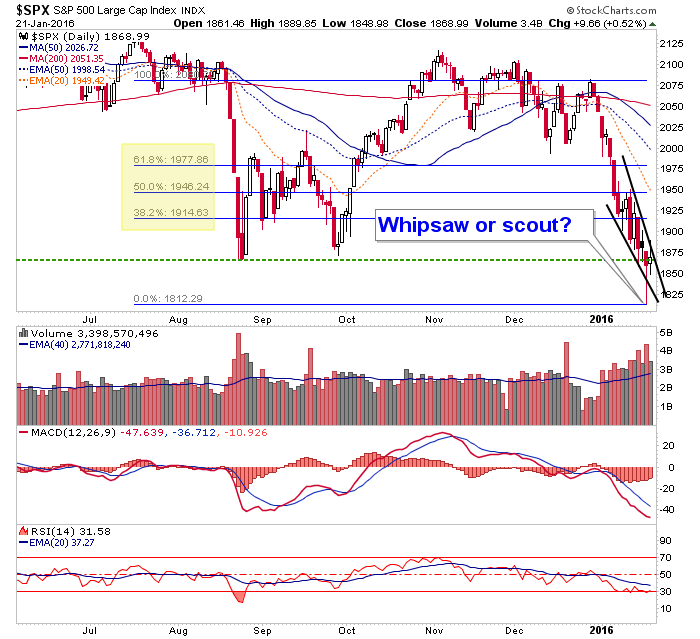
I was not buying (actually, I did) the breakdown below critical support and indeed noted “SPX has dropped below the critical support area that you, I and everyone else now sees. What a perfect time for a whipsaw and bounce.” in an NFTRH update. A short-term whipsaw is what it appears to have been.
This quote above was not bravado, it was the weight of the probabilities based on other indexes like the DJINET (unbroken and at support, as noted in public posts at Biiwii) and the SOX (hit 562 with our ‘swing low’ support zone at 540 to 560, which is massive long-term support).
Assuming a bounce is in the works, as the probabilities (and now, today’s pre-market) indicate, the minimum expected bounce area is 1915. It does not seem like much, but for those who positioned during the downside, it could be a decent little trade. First, SPX has to break the Wedge. In that case, the downward spike below support would be a scout for future bear activity. Meanwhile, much will depend on incoming technical, macro and sentiment data. A bounce to SPX 2000 would be a gift for would-be bears.
Aside from over sold technicals, there was pervasively over-bearish sentiment, approaching the configuration of last summer’s fright fest. We projected a bounce back then because the market needed a sentiment reset, and boy did it ever get one. From Sentimentrader:
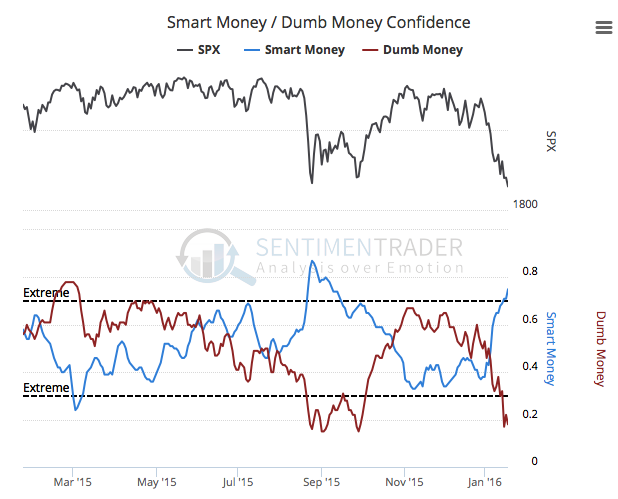
Sentiment is not a timer, but it is a probabilities enhancer; a condition that must be in place in making a swing limit point (in this case to the bearishness).
Back on the charts…
The weekly chart shows that SPX plunged down below the summer lows (thus creating whipsaw potential to purge out the remaining bullish holdouts) but has bounced from flimsy looking (but critical) support defined as the October 2014 lows. Here we note more clearly the potential best bounce (swing) objective of 2000, which includes very well defined resistance and a couple of down-turned moving averages that have supported the bull market in the past.
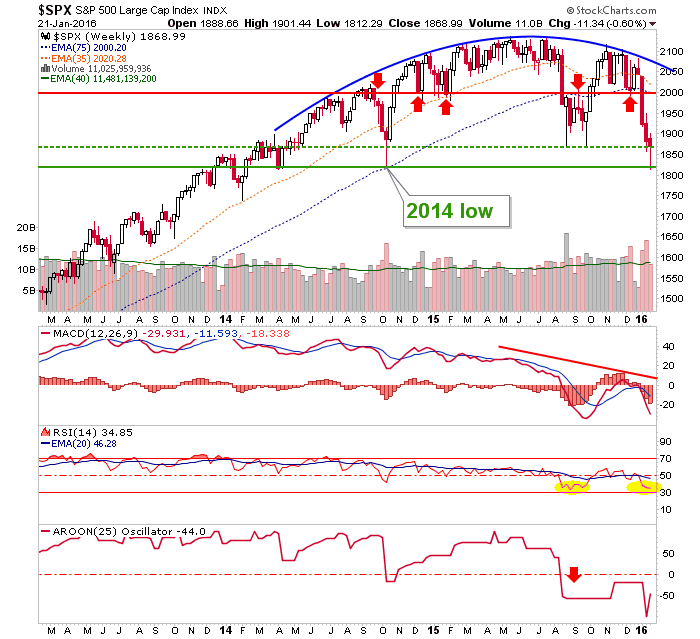
So ladies and gentlemen, there is our best ‘swing’ objective. I and I assume those NFTRH subscribers who chose to step up to the plate can consider that a ‘sell’ or re-short level of high confidence. Meanwhile, with the way this market has been bucking we cannot rule out a weaker bounce or continued volatility in the short-term.
The chart directly above shows an index in an intermediate bearish trend. The best opportunities are likely to be bearish in the first half of 2016. Proceed accordingly.
A final note on swing trading; I read an adviser the other day who stated that if you are down less than the market in 2016, you are winning. A swing trader who stays disciplined would seek to debunk that notion and make gains in both directions, while being cognizant of the probabilities at all times. I am moderately positive for 2016 but now that the market is in motion (i.e. volatile), hope to increase that performance as the year goes on.
Subscribe to NFTRH Premium for your 25-35 page weekly report, interim updates (including Key ETF charts) and NFTRH+ chart and trade ideas or the free eLetter for an introduction to our work. Or simply keep up to date with plenty of public content at NFTRH.com and Biiwii.com.
By Gary Tanashian
© 2016 Copyright Gary Tanashian - All Rights Reserved
Disclaimer: The above is a matter of opinion provided for general information purposes only and is not intended as investment advice. Information and analysis above are derived from sources and utilising methods believed to be reliable, but we cannot accept responsibility for any losses you may incur as a result of this analysis. Individuals should consult with their personal financial advisors.
Gary Tanashian Archive |
© 2005-2022 http://www.MarketOracle.co.uk - The Market Oracle is a FREE Daily Financial Markets Analysis & Forecasting online publication.