


Silver Price Hitting Major Support
Commodities / Gold and Silver 2016 Jan 20, 2016 - 05:05 PM GMTBy: InvestingHaven

 The long term silver chart is truly spectactular. It has basically 3 time periods since it started its bull market.
Phase I started in 2003 and lasted till 2010. Phase II was a trend change, indicated with the rectangle below, between 2011 and 2013, an extremely volatile period. Phase III is the current phase, and is basically a clear downtrend.
Silver is forming a triangle, and it is hitting support right now. Moreover, the resistance line (in purple) is very close to hitting support. In other words, silver has to choose a direction pretty soon. Given this chart formation, we believe that 2016 will be the year in which the market will have to make a choice, and basically there are only two options: break out or break down.
Uncoincidentally, we came to the same conclusion when analyzing the gold market, just one week ago: Gold’s Last Chance: It’s Now Or Never.
Chart courtesy: Sharelynx, our annotations.
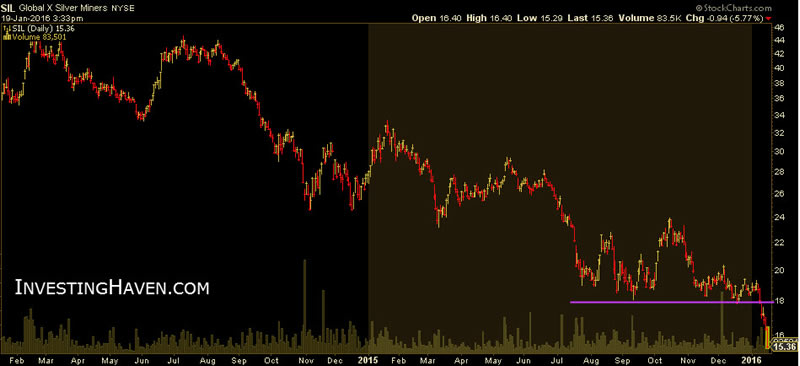
The leading indicator in the precious metals complex is the mining sector. In other words, miners could provide some clues about the future direction of the metals. So let’s revise two silver mining charts.
The first chart shows the group of silver miners: SIL. Note that SIL’s chart is a daily chart on 2 years while spot silver above is a long term chart. The rationale to look at a mining chart of lesser degree is that the shorter term provides clues about the longer term.
Chart-wise, we see that SIL is testing support. The bad news on the SIL chart is that support has broken. That is not a constructive sign for silver bulls.
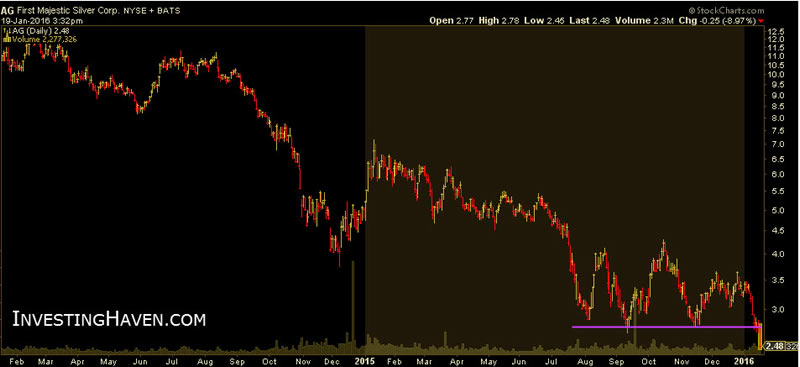
The second miners we have chosen is First Majestic Silver (AG), one of the largest pure silver plays. AG has broken support only this week. It could well be possible that this is a false breakdown. But, here as well, the chart does not look very constructive, and silver bulls would hope to see a very quick recovery.
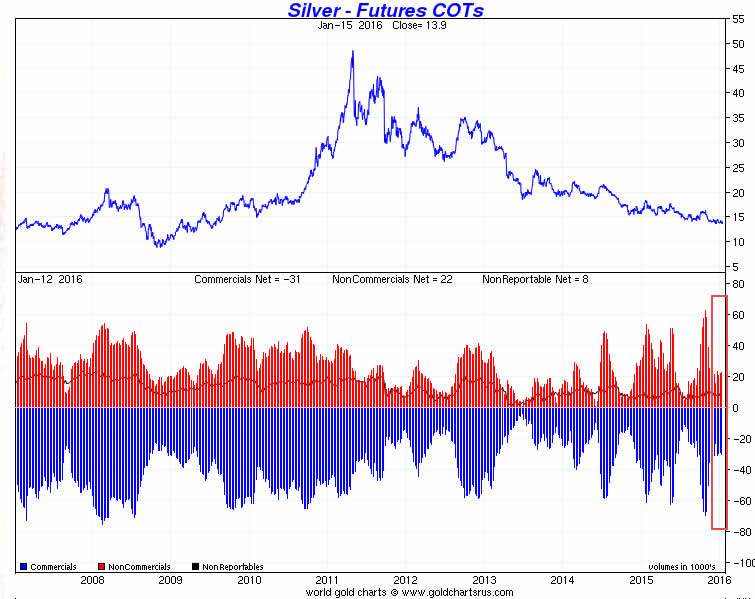
Another leading indicator in our methodology is the COMEX silver market structure. Particularly, the level of short positions from commercial traders, as well as the rate of change, provide some insights about future price direction. As can we see on the next chart, see red annotation, the short position is not extremely low (rather a neutral signal), and there is no real rate of change in the last couple of weeks (neutral outlook).
CONCLUSION:
We conclude that the silver mining sector, being considered as a leading indicator for the grey metal, is currently testing support, and is not sending a sign of strength. COMEX silver is neutral, suggesting no significant price movements should be expected in the short term.
Chart-wise, we see an important decision point nearing, somewhere in 2016 silver has to break out or break down. Probably, it will take a couple of months until we reacht that point. So far, however, the silver mining sector is not sending any bullish sign.
Analyst Team
The team has +15 years of experience in global markets. Their methodology is unique and effective, yet easy to understand; it is based on chart analysis combined with intermarket / fundamental / sentiment analysis. The work of the team appeared on major financial outlets like FinancialSense, SeekingAlpha, MarketWatch, ...
Copyright © 2015 Investing Haven - All Rights Reserved Disclaimer: The above is a matter of opinion provided for general information purposes only and is not intended as investment advice. Information and analysis above are derived from sources and utilising methods believed to be reliable, but we cannot accept responsibility for any losses you may incur as a result of this analysis. Individuals should consult with their personal financial advisors.
© 2005-2022 http://www.MarketOracle.co.uk - The Market Oracle is a FREE Daily Financial Markets Analysis & Forecasting online publication.