


Brazillian Bovespa Stock Market Set To Rally
Stock-Markets / Brazil Jan 15, 2016 - 07:51 AM GMTBy: Austin_Galt

 The Brazillian stock index, the Bovespa, has generally been trading exactly as outlined back in May 2015 and I believe we now have the final low at hand with today's low of 38459.
Let's analyse the technicals using the daily and monthly charts.
Bovespa Daily Chart
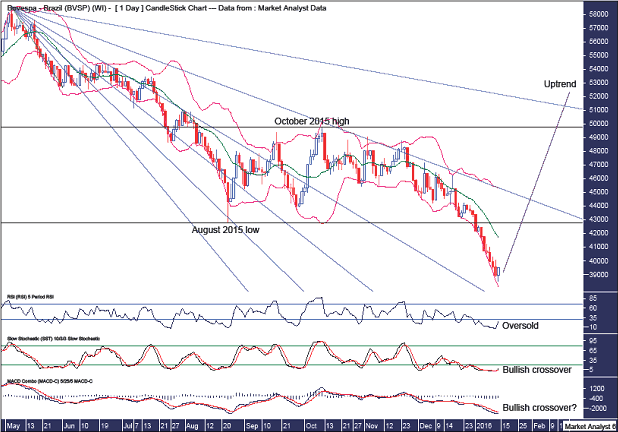
We can see today's candle was a bullish reversal and while it is only one candle it is in the previously projected zone for low which we will come to shortly.
The recent price action shows a capitulation move down which gained momentum after breaking below the August 2015 low which is denoted by the lower horizontal line.
The Bollinger Band show price clinging to the lower band and leaving this band will likely mean the downtrend has indeed finished.
I have drawn a bearish Fibonacci Fan from the May 2015 high to first lower low and this shows some nice symmetry with price. The August 2015 low was right at support from the 38.2% angle, while the October 2015 reaction high and subsequent lower highs were right around resistance from the 76.4% angle. Breaking above this angle now would look very bullish in my opinion.
The RSI is well oversold and it is not out of the question for price to trade marginally lower over the coming days and set up a bullish divergence although I have my doubts about that. We'll know either way shortly.
The Stochastic indicator has just made a bullish crossover while the MACD indicator looks to be threatening one.
Breaking above the October 2015 high of 49759 will confirm a new bull trend is in play.
Let's move on to the monthly chart.
Bovespa Monthly Chart
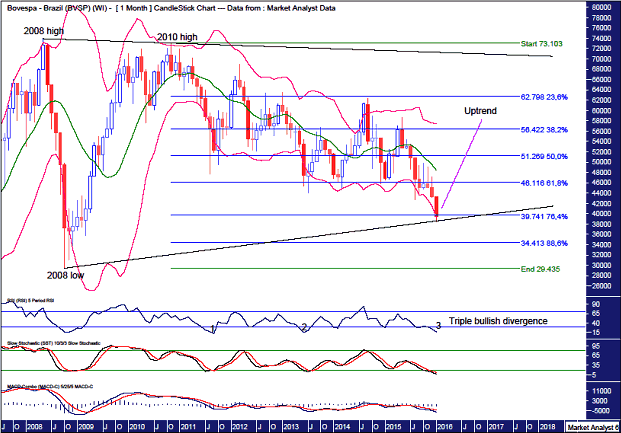
I have added Fibonacci retracement levels of the move up from 2008 low to 2010 high and in previous analysis back in May 2015 I outlined my expectation for the final low to nudge a bit lower than the 76.4% level which stands at 39741. Today's low of 38459 looks to be the bingo number!
The Bollinger Bands show price back at the lower band. Does price bounce back up off this band or continue down the lower band? Obviously, I favour a bounce.
I have drawn two trend lines which I believe to be forming a triangle shaped consolidation zone and my expectation now is for price to head back up towards the trend line originating from the 2008 high and connecting the 2010 high.
This low sets up a triple bullish divergence on the RSI which often leads to a significant rise and that is my expectation here.
Both the Stochastic and MACD indicators are bearish but both conditions are looking long in the tooth and a nice price rise would see both make bullish crossovers in the near future.
Summing up, I believe conditions are right to change the bias from bearish to bullish.
By Austin Galt
Austin Galt is The Voodoo Analyst. I have studied charts for over 20 years and am currently a private trader. Several years ago I worked as a licensed advisor with a well known Australian stock broker. While there was an abundance of fundamental analysts, there seemed to be a dearth of technical analysts. My aim here is to provide my view of technical analysis that is both intriguing and misunderstood by many. I like to refer to it as the black magic of stock market analysis.
Email - info@thevoodooanalyst.com
© 2016 Copyright The Voodoo Analyst - All Rights Reserved
Disclaimer: The above is a matter of opinion provided for general information purposes only and is not intended as investment advice. Information and analysis above are derived from sources and utilising methods believed to be reliable, but we cannot accept responsibility for any losses you may incur as a result of this analysis. Individuals should consult with their personal financial advisors.
Austin Galt Archive |
© 2005-2022 http://www.MarketOracle.co.uk - The Market Oracle is a FREE Daily Financial Markets Analysis & Forecasting online publication.