


The Incredible Commodities - Stock Market Divergence and What it Portends...
Stock-Markets / Stock Markets 2016 Jan 04, 2016 - 03:57 PM GMTBy: Clive_Maund

 As we approach the end of the year we are going to review one of the most extraordinary divergences that we have witnessed in modern times. This is very important because once you grasp the magnitude of this divergence and what it implies, you will be able to position yourself to firstly avoid harm and secondly capitalize on a reversion to the mean of this divergence, which, because it is so extreme, looks inevitable.
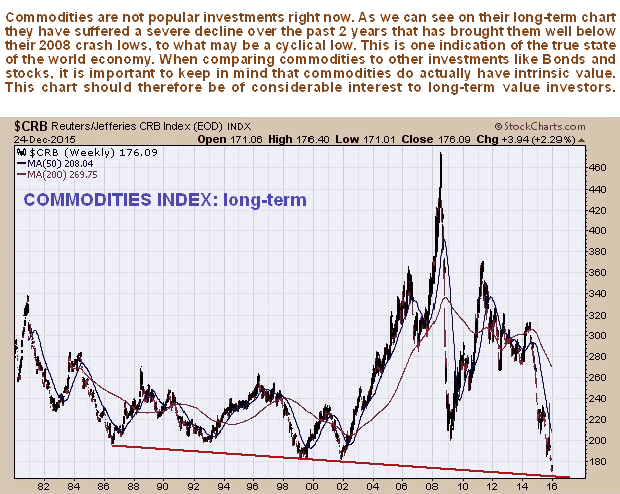
The divergence that we are referring to is the collapse of the Commodity sector in recent years, as the broad stockmarket has continued to ascend into the stratosphere.
There are various indications that the world economy is imploding. One is the Baltic Dry shipping index, which is in the basement, another is the commodity indices, one of which we will look at here. The long-term chart for the CRB commodity index shows that it has dropped to new multi-decade lows in recent weeks, and when we say new lows, we mean its lowest levels for over 42 years! This is a warning of impending economic depression, which has already arrived in some countries, as we know.
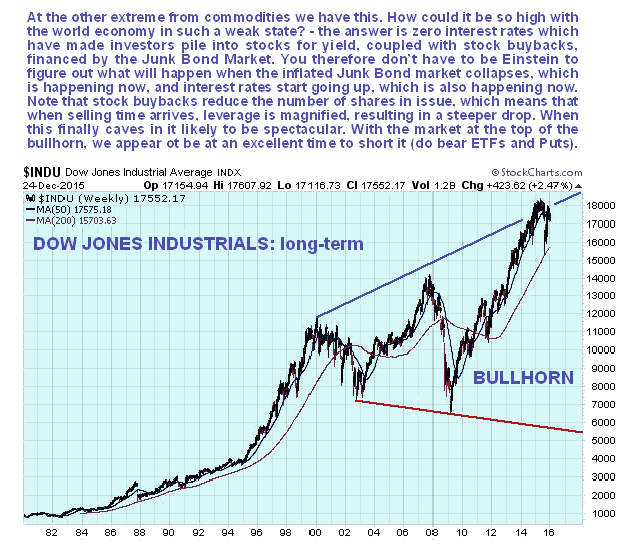
Meanwhile, the US stockmarket, as shown by the Dow Jones Industrials has somehow managed to stay at very elevated levels, although as we can see on its long-term chart below, it is topping out near the upper boundary of a gigantic bearish "bullhorn" pattern. Why is it still so high? The two biggest reasons are a prolonged period of zero interest rates, which have caused investors to flock to stocks in search of yield, with the 2nd reason a related one, rampant stock buybacks by management seeking to bolster their own stock prices, and taking advantage of very low interest rates to accomplish this, in order to make their companies look better than they really are and to line their own pockets, since they often own stock and options. Now, however, with rates starting to rise and the Junk Bond market caving in, these two big drivers are starting to disappear. This means that stocks are set to drop, and with widespread stock buybacks having reduced the number of shares in issue for many companies, downside leverage will kick in and exacerbate declines - stocks could easily crash soon from these lofty levels and are expected to.
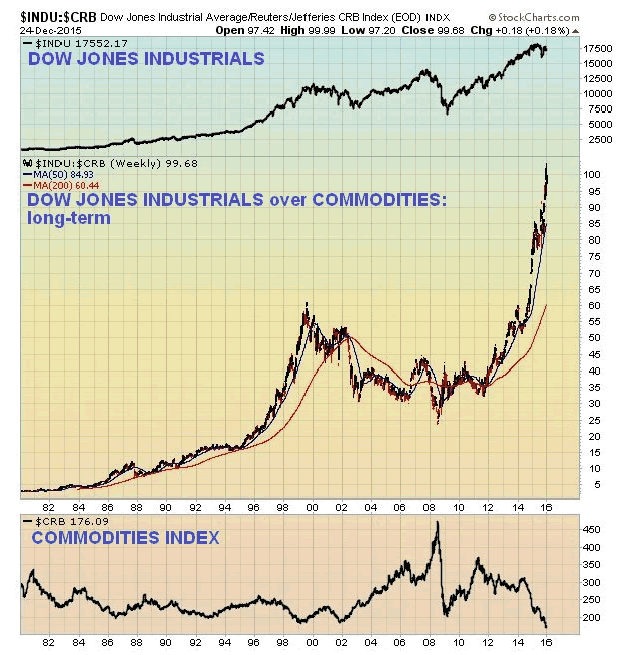
If we plot the performance of the broad market Dow Jones Industrials relative to commodities going back many years, the result is a truly shocking chart which begs the question "What has caused the stockmarket to explode by 30 times relative to commodities over the past 35 - 40 years? The answer is the abolition of the gold standard in 1971 by Richard Nixon, which effectively removed all discipline and restraint from the market. It was a Keynesian's nirvana - currency and debt was free to balloon exponentially - and that meant the prices of anything and everything it could drive higher - bonds, stocks, derivatives and property etc. Unlimited debt has been used to drive the stockmarket higher and higher, but now we have arrived at debt saturation, where the bubble has reached gigantic and unsustainable proportions and cannot be pumped up any more - due to a broad and growing realization amongst creditors that they are never going to be repaid - at least not in honest coin. This monstrous trans-global bubble is imploding, which is why the shipping index and commodities index are in the basement, and why real interest rates are starting to rise and likely to accelerate higher. Clearly this development will kill whatever economic recovery there is stone dead, and send stockmarkets spiraling lower.
So next year is likely to prove to be turbulent in the extreme, and the old line wheeled out by financial journalists and the government that "Nobody could have seen this coming" is likely to become very overused. While many investors will be similarly bewailing their fate, those who see this coming will be able to not just protect their capital from this maelstrom, but multiply it via bear ETFs and Puts, which is what we aim to do.
Simple common sense dictates that the logical trade at least over the long-term is out of the broad stockmarket and into commodities, but in the initial steep declining phase, probably involving one of more crash phases, many commodities, particularly industrial commodities, may get dragged even lower, although they are so low now that they are thought to be near a bottom. However, there will be few options for hot money as it attempts to flee to safety, as all but the safest bonds will also be at risk of selling off too, because of the spreading Sovereign debt risk which barely existed in comparison back in 2008. For this reason commodities, which are real resources with intrinsic value will come back into favor, and gold and silver will quickly become very attractive and a vigorous bullmarket should quickly develop in them, because they are a tiny market and the amount of hot money on the move and seeking safe haven will be fantastic. The first signs of this will be a breakout on good volume from the downtrend in force from the 2011 - 2012 highs. This could be close at hand and may even start after the end of year tax selling.
This article will in time disappear from the Homepage, and perhaps be forgotten, but we should not forget the extraordinary divergence between the broad stockmarket and commodities that the charts above show, which make a big migration from the former into the latter inevitable.
By Clive Maund
CliveMaund.com
For billing & subscription questions: subscriptions@clivemaund.com
© 2015 Clive Maund - The above represents the opinion and analysis of Mr. Maund, based on data available to him, at the time of writing. Mr. Maunds opinions are his own, and are not a recommendation or an offer to buy or sell securities. No responsibility can be accepted for losses that may result as a consequence of trading on the basis of this analysis.
Mr. Maund is an independent analyst who receives no compensation of any kind from any groups, individuals or corporations mentioned in his reports. As trading and investing in any financial markets may involve serious risk of loss, Mr. Maund recommends that you consult with a qualified investment advisor, one licensed by appropriate regulatory agencies in your legal jurisdiction and do your own due diligence and research when making any kind of a transaction with financial ramifications.
Clive Maund Archive |
© 2005-2022 http://www.MarketOracle.co.uk - The Market Oracle is a FREE Daily Financial Markets Analysis & Forecasting online publication.