


Stocks Bull Market Continues With 9% Risk
Stock-Markets / Stock Markets 2016 Jan 01, 2016 - 01:00 PM GMTBy: Tony_Caldaro

 A choppy week to end the year. The market started Monday at SPX 2061. After a gap down opening on Monday, and drop to SPX 2044, the market rallied to 2082 with a gap up opening on Tuesday. Wednesday and Thursday were all downhill, aided by a gap down opening Thursday, and the market ended the week at SPX 2044. For the week the SPX/DOW lost 0.75%, the NDX/NAZ lost 0.70%, and the DJ World lost 0.60%. Economic reports for the week were light and negative. On the downtick: the WLEI, Chicago PMI, pending homes sales and the weekly jobless claims were higher. On the uptick: consumer confidence. Next week’s reports will be highlighted by the FOMC minutes, monthly Payrolls, and the ISMs. Happy New Year!
LONG TERM: bull market
It is interesting to note, since 1982 equities have been in a bull market 85% of the time. Yet, many are all too eager to claim a bear market when the market struggles to make new highs, or enters a downtrend. It is also interesting to note the following yearly results, year over year, since the bull market began: 2009 (+23.4%), 2010 (+12.8%), 2011 (0%), 2012 (+13.4%), 2013 (+29.6%), 2014 (+11.5%), and 2015 (-0.6%). Yes, 2015 is the first year over year loss. But the market would have been unchanged, like 2011, if not for the last two hours of trading on Thursday 12/31/2015.
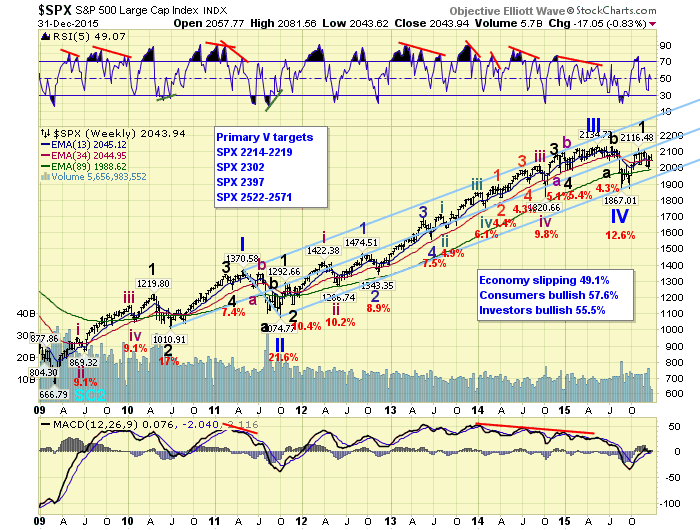
If one reviews the chart above they will notice that during 2011 (0%) and 2015 (-0.6%) the market experienced its Primary waves II and IV respectively. So the yearend results are quite close to what has normally occurred during this bull market. Should the market continue to perform in 2016 as it has done during this bull market, we should expect a rise of 12.8% (mean), or 13.0% (average), to SPX 2306-2310 by yearend. While we continue to see the bull market extending into year seven, its price action has provided an excellent long term stop less than 9% below the yearend SPX 2044 close. Simply put, if the SPX drops 9% from the yearend close, at any time during 2016, it has probably entered a bear market.
MEDIUM TERM: up/down trend remains at inflection point
The year 2015 was quite a choppy year, and similar to the year 2011. In both years the market rallied to bull market highs in May. Then both experienced two of the three biggest corrections of the entire bull market: Primary waves II and IV. This was followed by a Major wave 1 uptrend and Major 2 downtrend into Q4. And both years the SPX finished relatively unchanged. The only difference we can see, using OEW analysis, is that in 2011 a Major wave 3 uptrend was already confirmed heading into yearend. And, in 2015 it has yet to be confirmed. Other than that, and the depth and length of the Primary waves corrections, the two years look quite similar.
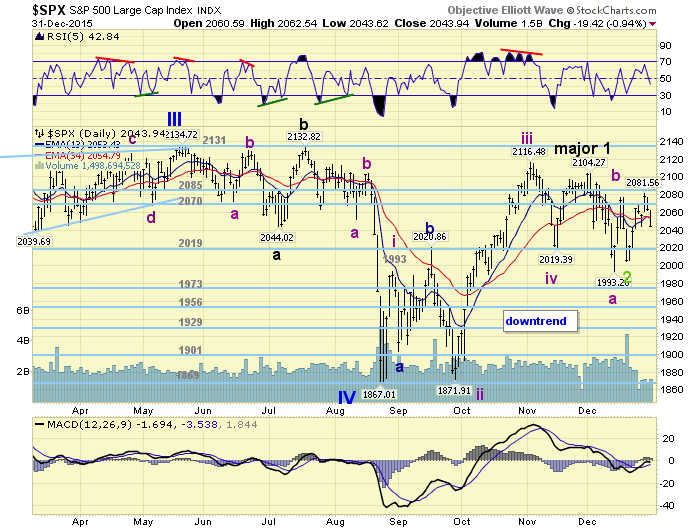
From the SPX 1867 Primary IV low in August we labeled five waves up to SPX 2104. SPX 2116 was the actual high, but we counted the uptrend as a failed fifth wave: 1993-1872-2116-2019-2104. The quick two week selloff that followed, which normally occurs after failed fifth waves, took the market down to SPX 1993. After that the market rallied in an apparent three wave structure to SPX 2077, and then headed lower again. While we were expecting a retest of SPX 1993, or the 1973 pivot, the market suddenly reversed at SPX 2005. Failing to make an equal or lower low. Only the DOW met this parameter, not the NAZ/NDX either. As a result the past three weeks have been a bit difficult to track, as we have observed a rally to SPX 2077, a decline to 2005, and a rally to 2082.
The internal structure of the SPX 2077 rally looked impulsive until it hit 2060, then it became quite choppy as it rose to 2077 and headed lower. The recent rally, however, continues to look impulsive despite the big pullback late in the week. If it is also just another counter-trend rally we would expect SPX 1993 or even the 1973 pivot to be tested next. Hopefully 2016 will produce a market that trends again rather than the choppiness of 2015. Medium term support is at the 2019 and 1973 pivots, with resistance at the 2070 and 2085 pivots.
SHORT TERM
As noted above, from the recent SPX 2005 low we can count five waves up: 2023-2006-2067-2044-2082. Then over the last 2+ days the market has declined in three waves: 2046-2063-2044. At Friday’s SPX 2044 low the market had retraced exactly 50% of the recent 2005-2082 rally. At SPX 2034 the retracement would be 61.8%. Anything lower, and this potential uptrend will start looking corrective again.
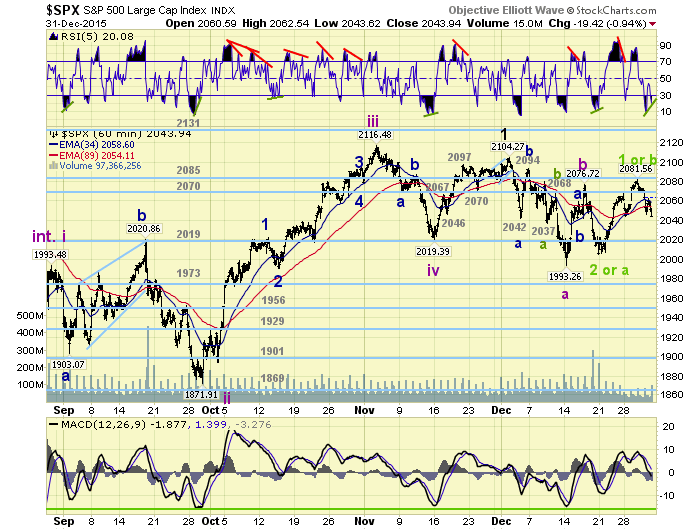
Overall the market looks good for 2016, but this potential uptrend is still have problems getting into gear on the upside. Short term support is at SPX 2044 and the 2019 pivot, with resistance at the 2070 and 2085 pivots. Short term momentum displays a positive divergence at Friday’s close after hitting extremely oversold. Best to your trading to start the year.
FOREIGN MARKETS
Asian markets were mixed on the week for a net gain of 0.3%.
European markets were mostly lower but gained 0.1%.
The Commodity equity group were all lower for a net loss of 2.3%.
The DJ World index remains in a downtrend and lost 0.6% on the week.
COMMODITIES
Bonds are still in a downtrend and lost 0.2% on the week.
Crude is also in a downtrend and lost 2.8% on the week.
Gold is in a downtrend too and lost 1.5% on the week.
The USD looks to be in an uptrend and gained 0.7% on the week.
NEXT WEEK
Sunday: speech from FED vice chair Fischer at 1:15. Monday: Construction spending and ISM manufacturing at 10am. Tuesday: Auto sales. Wednesday: the FOMC minutes, ADP, Trade deficit, Factory orders and ISM services. Thursday: weekly Jobless claims. Friday: monthly Payrolls (est. +200K), Wholesale inventories and Consumer credit.
CHARTS: http://stockcharts.com/public/1269446/tenpp
After about 40 years of investing in the markets one learns that the markets are constantly changing, not only in price, but in what drives the markets. In the 1960s, the Nifty Fifty were the leaders of the stock market. In the 1970s, stock selection using Technical Analysis was important, as the market stayed with a trading range for the entire decade. In the 1980s, the market finally broke out of it doldrums, as the DOW broke through 1100 in 1982, and launched the greatest bull market on record.
Sharing is an important aspect of a life. Over 100 people have joined our group, from all walks of life, covering twenty three countries across the globe. It's been the most fun I have ever had in the market. Sharing uncommon knowledge, with investors. In hope of aiding them in finding their financial independence.
Copyright © 2015 Tony Caldaro - All Rights Reserved Disclaimer: The above is a matter of opinion provided for general information purposes only and is not intended as investment advice. Information and analysis above are derived from sources and utilising methods believed to be reliable, but we cannot accept responsibility for any losses you may incur as a result of this analysis. Individuals should consult with their personal financial advisors.
Tony Caldaro Archive |
© 2005-2022 http://www.MarketOracle.co.uk - The Market Oracle is a FREE Daily Financial Markets Analysis & Forecasting online publication.