


Crude Oil, SP500, Exxon Mobil - When Will They Bottom?
Stock-Markets / Financial Markets 2015 Dec 28, 2015 - 06:55 AM GMTBy: Chris_Vermeulen

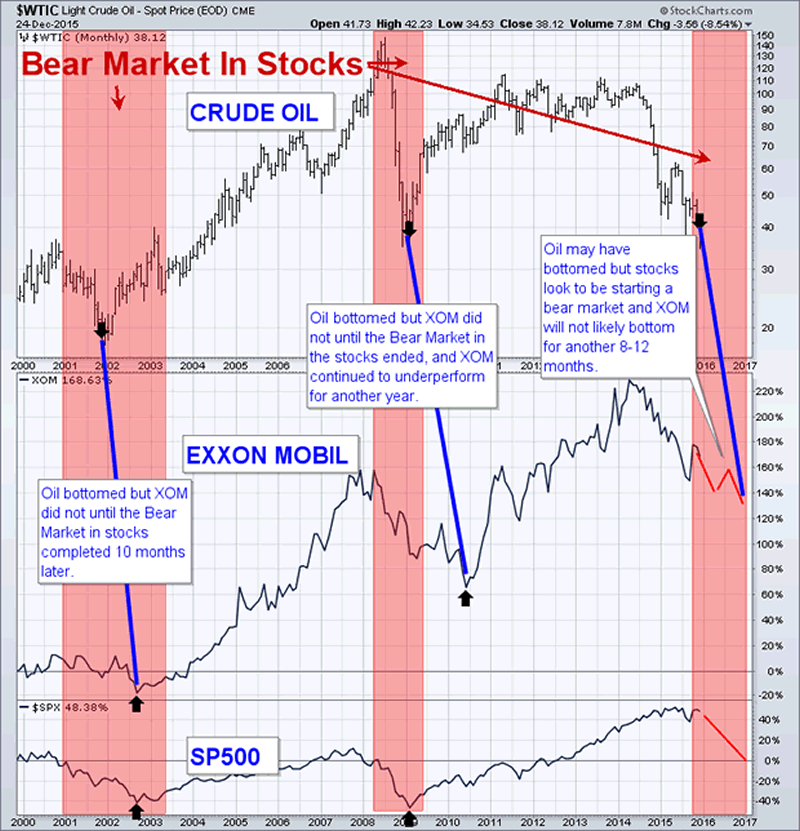
 A full blown bear market in energy resources and energy stocks has been underway since mid-2014. History shows that the price of crude oil typically bottoms before the broad stock market. And oil related stocks bottom at the same time or later than the broad market.
The monthly chart below shows how oil bottoms several months before the stock market does. This provides us with some insight on when we should start to expect a bear market to end in the US stock market.
Many traders follow and trade shares of Exxon Mobil. And while the are big money maker I do feel their share price is going to underperform oil for some time. Based on my research XOM has acquired many new oil operations, which many require $70+ per barrel to be profitable. This has cost XOM a considerable amount of capital and is now left holding and operating business that are losing money with the current price of oil sub $40 per barrel.
Base on my analysis, economic data and forecast I feel as though oil will remain low for another 3-9 months below $60 per barrel. It will do this for several reasons but what matter to us is that it forced the majority of oil producers to cap and close off well and go out of business. While this is taking place stocks and the economy will rebalance through a strong economic recession and a bear market in equities that will last most if not longer than 2016.
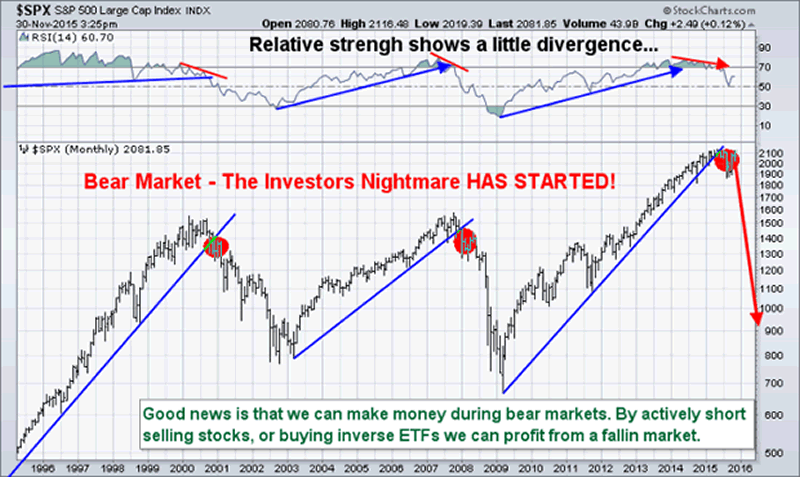
Take a look at the US stock market average (SP500 index) in the chart below. While this chart is a very basic and simple looking forecast understand that the stock market internals and market breadth have completely collapsed just s we saw in 2000 and again in 2008 months before the index collapsed and started bear markets.
Oil, XOM, and Stock Trading Conclusion:
In short, I expect oil to find a bottom during the next 1-3 months. Oil services stocks on average are likely to trade sideways and build a basing pattern. These oil services stocks will not breakout and rally until the broad stock market has bottomed which I expect to happen late in 2016 or early 2017.
Unfortunately, oil and oil stocks collapsed so fast without any retest or pause for us to get short and enjoy the ride down for profits. I feel trading oil and oil stocks will be choppy and tough in the near year. Last week subscribers and I played the energy (XLE) for a quick two-day pop of 2-4% return depending on entry and exit. These types of plays will continue, but the big trend trade in oil and energy are a long way away yet.
The easier money will be likely be shorting the stock market (buying inverse ETFs) to profit as stocks collapse which is what I provide subscribers to my ETF trade alert newsletter: www.TheGoldAndOilGuy.com
Chris Vermeulen
Join my email list FREE and get my next article which I will show you about a major opportunity in bonds and a rate spike – www.GoldAndOilGuy.com
Chris Vermeulen is Founder of the popular trading site TheGoldAndOilGuy.com. There he shares his highly successful, low-risk trading method. For 7 years Chris has been a leader in teaching others to skillfully trade in gold, oil, and silver in both bull and bear markets. Subscribers to his service depend on Chris' uniquely consistent investment opportunities that carry exceptionally low risk and high return.
Disclaimer: Nothing in this report should be construed as a solicitation to buy or sell any securities mentioned. Technical Traders Ltd., its owners and the author of this report are not registered broker-dealers or financial advisors. Before investing in any securities, you should consult with your financial advisor and a registered broker-dealer. Never make an investment based solely on what you read in an online or printed report, including this report, especially if the investment involves a small, thinly-traded company that isn’t well known. Technical Traders Ltd. and the author of this report has been paid by Cardiff Energy Corp. In addition, the author owns shares of Cardiff Energy Corp. and would also benefit from volume and price appreciation of its stock. The information provided here within should not be construed as a financial analysis but rather as an advertisement. The author’s views and opinions regarding the companies featured in reports are his own views and are based on information that he has researched independently and has received, which the author assumes to be reliable. Technical Traders Ltd. and the author of this report do not guarantee the accuracy, completeness, or usefulness of any content of this report, nor its fitness for any particular purpose. Lastly, the author does not guarantee that any of the companies mentioned in the reports will perform as expected, and any comparisons made to other companies may not be valid or come into effect.
Chris Vermeulen Archive |
© 2005-2022 http://www.MarketOracle.co.uk - The Market Oracle is a FREE Daily Financial Markets Analysis & Forecasting online publication.