


Stock Market Game Changing Action
Stock-Markets / Stock Markets 2015 Dec 14, 2015 - 04:18 PM GMTBy: Bob_Loukas

 It appears as if the worm has finally turned for the equity markets. The S&P 500 recorded its largest weekly decline since August, and the broader risk markets took a beating. The price of Crude fell under $35 a barrel and high yield bonds took an absolute drubbing. Friday's big decline in equities was on extremely high volume - the highest in 6 weeks - and the volatility index (VIX) jumped 26% in its biggest one-day percentage increase of the year.
This past week's performance notwithstanding, we have been through enough face-ripping reversals in equities to know that, in the end, one move may prove meaningless to the broader trend. Volatility and reversals have been a characteristic of the 2015 market, so we need to consider the current action in that context. But if I can be so bold, I'd like to depart from my normal reliance on evidence to suggest that I have a "sense" that this time might be different for equities.
Commodities and the emerging markets are scaring the heck out of traders, and there is rampant fear that deflation will sweep through the markets. Compounding the problem at a time when the market seems vulnerable, the FED is universally expected to raise interest rates for the first time in almost a decade. This is why the FED's looming FOMC rate decision has really become the variable in the short term. The market is clearly saying that it cannot support a FED rate hike.
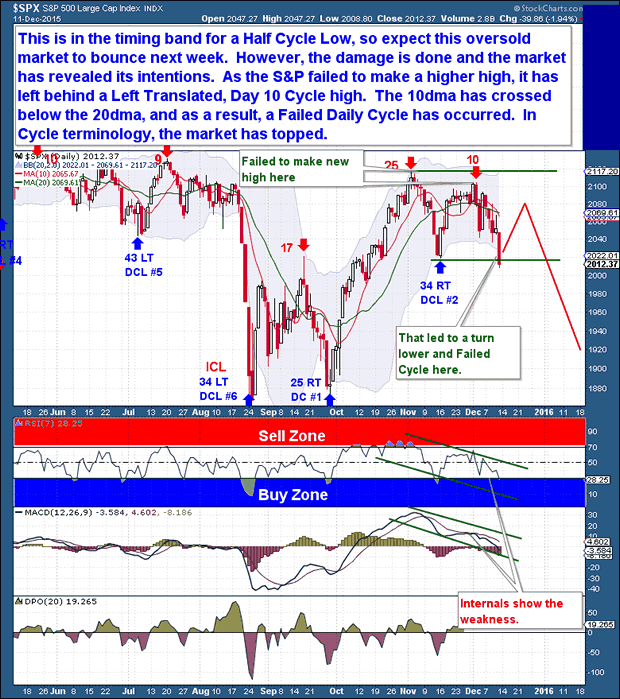
In the short term, the S&P is well within the timing band for a Half Cycle Low so we should expect a bounce next week regardless of longer term direction. But in my opinion, the bounce won't come to much - the damage is already done. The market has revealed its intentions.
Beyond my anecdotal narrative that the market is suddenly in trouble, there is bearish evidence in the Cycles. The S&P failed to make a higher high last week, which was the first clue that it might be topping. And on Friday, when it dropped below the last Daily Cycle Low (DCL), the S&P confirmed a failed, Left Translated Daily Cycle (DC) with a day 10 Cycle high. In addition, the 10dma has crossed below the 20dma. It's clear that equities have almost certainly topped for this Investor Cycle (IC), and future breaks are likely to come to the downside.
A fair question would be how it's possible for me to be relatively bullish one week, and then outright bearish the next. The answer is simple - I call the markets as they appear, and I am not married to my calls. My analysis offers a working framework that incorporates all that I know about the markets at the time. My goal is not to pick a market turn well in advance, nor am I interested in being able to declare that I was right about one call or another. I'm focused on making money, and that means using all available information and controlling risk. Being stubborn is how traders end up taking 10%, 20% or even 30% losses on a position, and that is not how I trade. I might miss a good trade, but I will never be caught over-extended in a losing position because I have clung to a public call about market direction.
I form my opinions by relying on what the Cycles are telling me at any given time, and then combine it with a view of the price action. I've said many times that price action is what matters most, and we always need to make sure our framework aligns with the most recent price action, be it bullish or bearish. Whenever price changes character or breaks below a key Cycle pivot, the market is signaling that an important development has occurred, and we ignore it at our risk.
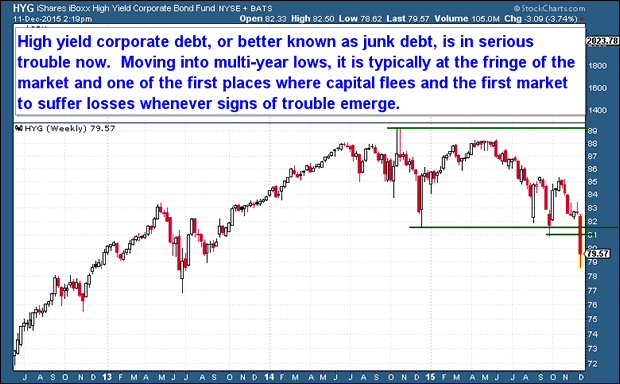
In addition to the clear breach of key Cycle points this week, other alarming developments surfaced, highlighted by the strong reversal in equities and the new short-term declining trend. The high yield corporate debt market appears to be in serious trouble, and now rests at a multi-year low. The junk bond market is typically one of the first places capital flees once signs of trouble emerge, so the decline in the market is a real tell for equities.
Junk bonds have been flashing a warning signal about capital market conditions for some time. But a divergence the size of what we are seeing today becomes especially significant once the market begins to break in the direction of the divergence.
When markets fueled on liquidity and speculative leverage are rising rapidly, traders seem unconcerned with valuation, because booming markets are all about confidence and greed. But once the confidence is broken, liquidity suddenly dries up and ridiculous asset valuations quickly seem to make no sense to anyone. That has not occurred - yet - in the current equity markets, but junk bonds do illustrate how quickly an overheated market can lose its support.
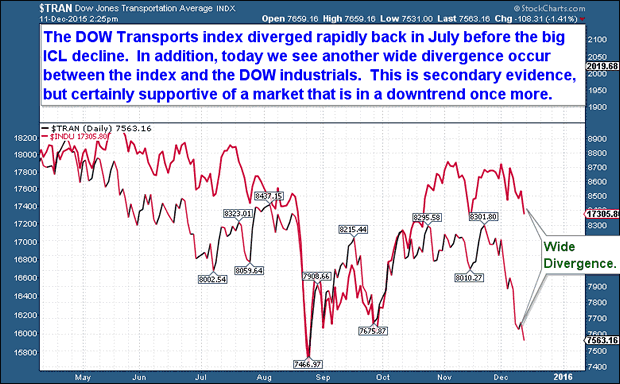
At any given time, there are various under-performing sectors that can be compared to the broader market. But no sector other than the Dow Transportation Index holds any real weight when identifying divergences between a sector and the general market. And in terms of the Transports, because Crude and energy prices are at seven-year lows, we would expect the Transports to be enjoying extremely favorable margins and higher equity prices. But that's not what's happening.
Before July's big S&P decline into an ICL, the DOW Transportation index diverged rapidly lower from the broader market. We see the same divergence today, this time between the Dow Transportation Index and the DOW Industrial Index. This is only secondary evidence, but is clearly supportive of a market that is in a downtrend.
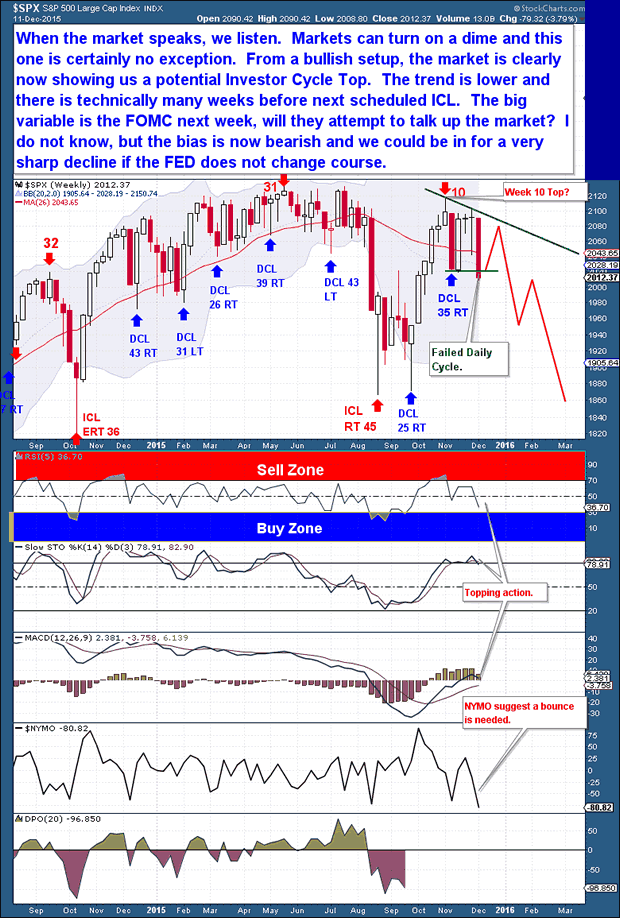
When the market speaks, we need to listen. Markets often turn on a dime and this one is certainly no exception - what has changed from a few weeks back are the trend and the evidence from Cycles. The failure of the S&P to form a higher high on the Daily chart, and a very clear, powerful decline that left a failed DC tell us that a trend change has occurred and an intermediate decline is underway.
The market has traveled quickly from a potentially bullish setup to a possible Investor Cycle Top. Although it can always change, the trend is now distinctly downward, and there are still many weeks before we should expect an ICL. The big variable on every time frame is the FOMC meeting next week. But regardless of what the FED does, my bias is now firmly in the bearish camp. I believe the market could be in for a very sharp decline in the coming weeks/months, especially if the FED decides to raise rates at next week's meeting.
Possible Trading Strategy
Longer term holders:
Once we see an oversold relief rally occur, back towards the 10 day moving average, you could look for a short trade that could be good to a weekly Cycle Low around the February time-frame.
Position Traders:
A scalp trade (long) is on offer here now, being the market is oversold and due a bounce in the 2nd half of this Daily Cycle. But the right play now is to allow the market to rebound, and then look for a Short position at around days 27-30 of the current Daily Cycle, probably in the 2,060-2,070 range on the S&P.
The Financial Tap publishes two member reports per week, a weekly premium report and a midweek market update report. The reports cover the movements and trading opportunities of the Gold, S&P, Oil, $USD, US Bond's, and Natural Gas Cycles. Along with these reports, members enjoy access to two different portfolios and trade alerts. Both portfolios trade on varying time-frames (from days, weeks, to months), there is a portfolio to suit all member preferences.
Try us out now, just $99 for a full 3 months of premium access. You're just 1 minute away from profitable trades! please visit: http://thefinancialtap.com/
By Bob Loukas
© 2015 Copyright Bob Loukas - All Rights Reserved
Disclaimer: The above is a matter of opinion provided for general information purposes only and is not intended as investment advice. Information and analysis above are derived from sources and utilising methods believed to be reliable, but we cannot accept responsibility for any losses you may incur as a result of this analysis. Individuals should consult with their personal financial advisors.
© 2005-2022 http://www.MarketOracle.co.uk - The Market Oracle is a FREE Daily Financial Markets Analysis & Forecasting online publication.