


US Bull Market to Extend Well into 2016
Stock-Markets / Stock Markets 2016 Dec 13, 2015 - 12:57 PM GMTBy: Tony_Caldaro

 The market started the week at SPX 2092. Monday started the week with a gap down opening. The market gapped down again on Tuesday and Wednesday before hitting a low at SPX 2037. Then after a quiet Thursday opening the market rallied to SPX 2068, before resuming its decline with another gap down opening on Friday. For the week the SPX/DOW lost 3.55%, the NDX/NAZ lost 3.95%, and the DJ World lost 3.5%. Economic reports for the week started off negative, but ended mixed. On the downtick: consumer credit, wholesale inventories, export/import prices, plus the budget deficit and weekly jobless claims increased. On the uptick: the PPI, MMIS, GNP, WLEI, retail sales and consumer sentiment. Next week will be highlighted by the FOMC meeting, Industrial production, Housing and Options expiration.
LONG TERM: bull market
Bad news is good news has been the theme of this bull market. When the economy was in the Great Recession the FED started QE 1 and the bull market began. When the economy was still weak in 2010 the FED started QE 2. With unemployment still high and the economy sputtering along the FED turned Operation Twist into QE 3 in 2012. When QE 3 ended in October 2014, and the FED started talking about rate normalization, the bull market started to sputter in 2015. Now it looks like the long awaited first rate increase since 2006 is heading our way.
During this entire period of time the expected Cycle wave [1] bull market has continued to unfold. Four of the expected five Primary waves have already completed. Primary waves I and II in 2011, and Primary waves III and IV in 2015. After Primary V got underway in earnest we were concerned of a potential bull market top occurring in the next few months. Over the past 30+ years, whenever the first uptrend, after a significant fourth wave, made new highs, that five wave sequence ended. If that first uptrend did not make new highs, then that fifth wave subdivided into five waves of its own and, the bull market extended.
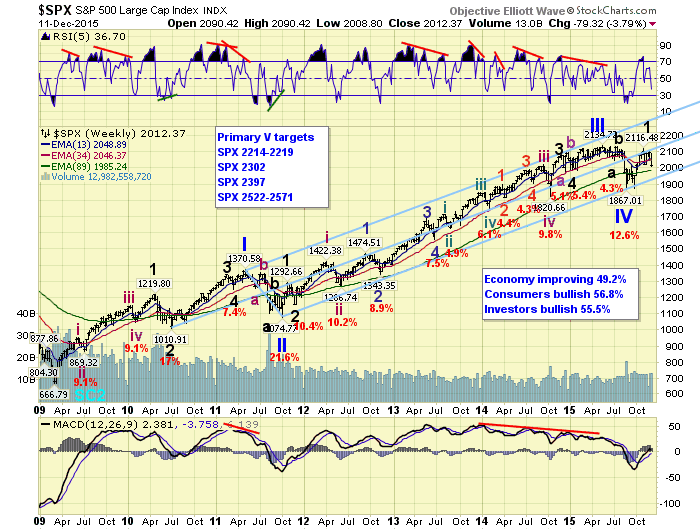
After a four month uptrend from the August SPX 1867 Primary IV low, the SPX failed to make new highs and is now in a confirmed downtrend. This suggests to us, that the bad news of the current correction will lead to the good news of an extending bull market into at least next year. Primary V now has to divide into five Major waves/trends before the bull market ends. The bad news is good news bull market continues.
MEDIUM TERM: downtrend
After the Primary IV downtrend low in August we labeled the five waves up of the new uptrend with Major waves. This was in anticipation that this first uptrend could end the bull market. The five waves progressed as expected, until the fifth wave failed to make a higher high in both the SPX/DOW. With the NDX/NAZ making higher highs, and the SPX/DOW not, we counted this pattern as a fifth wave failure. The five waves were SPX: 1993-1872-2116-2019-2104.
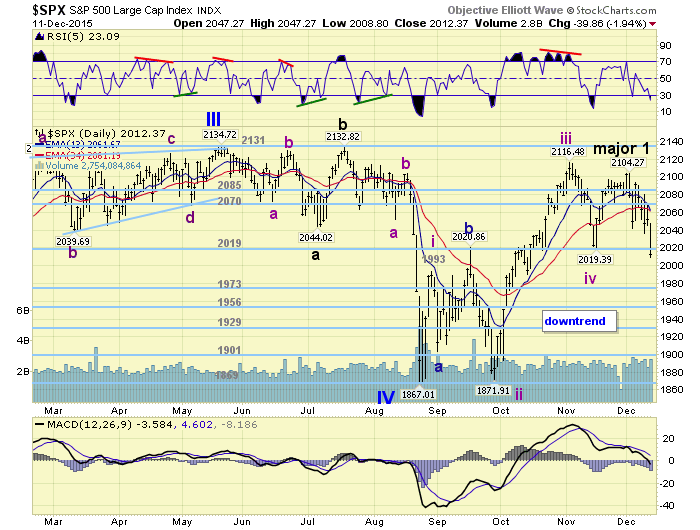
Now with the SPX/DOW also failing to make new bull market highs. The NAZ didn’t do that either. The labeling of the entire uptrend has to be downgraded one degree. The entire uptrend is now considered to be Major wave 1 of Primary V, and the current downtrend Major wave 2. Accordingly, the five waves that created the uptrend are now downgraded to Intermediate waves, as noted in the daily SPX chart. When Major wave 2 completes, possibly as early as next week, a Major wave 3 uptrend should begin. Medium term support is at the 1973 and 1956 pivots, with resistance at the 2019 and 2070 pivots.
SHORT TERM
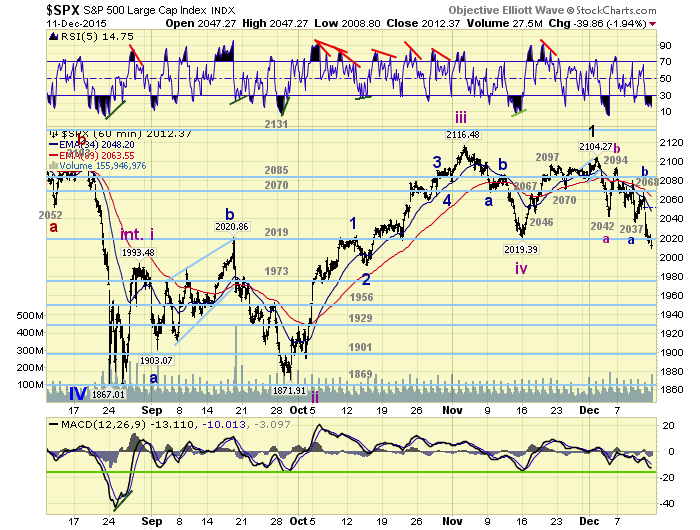
After the SPX failed to make a higher high during the rally from the mid-November 2019 low. We offered two possibilities: a failed fifth wave or a subdividing fifth wave. This is the reason for noting an inflection point in last weekend’s report. When the market started declining to start the week it did appear that the failed fifth scenario was underway. Since the entire week was quite a choppy affair to the downside we hesitated labeling a count until it began to gain some clarity. During the week we posted a potential downtrend count, and then added to that labeling on Thursday.
It appears this downtrend is unfolding in three Intermediate waves. Intermediate wave A at SPX 2042, Int. B at SPX 2094, and Int. C currently underway. While Int. A was a simple three wave decline: 2067-2078-2042, and Int. B a simple three wave advance: 2079-2070-2094, Int. C has been anything but simple. We have counted a Minor A zigzag from SPX 2094: 2052-2080-2037. Then a Minor B zigzag to SPX 2068: 2063-2050-2068. Now Minor wave C is underway from Thursday’s SPX 2068 high. Thus far it has declined in five overlapping waves: 2021-2034-2014-2024-2009.
When looking at retracement levels for Major 1 there are two levels of support: SPX 1992 (50%), and the 1956 pivot (61.8%). When reviewing the Intermediate waves of Major 2 we arrive at the following two levels SPX: 1993 and 1970. Finally, the Int. C substructure suggests SPX: 2011 and 1976. In summary we have three potential levels: SPX 1992/1993, the 1973 pivot and the 1956 pivot. Odd how after all this analysis it basically comes back to the OEW pivots.
With the likelihood of a rate increase on Wednesday, our leading indicator is suggesting one for the first time since 2006, and options expiration Friday, it should be quite a wild week. Short term support is at the SPX 1991/92 and the 1973 pivot, with resistance at the 2019 and 2070 pivots. Short term momentum ended the week quite oversold.
FOREIGN MARKETS
Asian markets were all lower on the week for a net loss of 2.4%.
European markets were also all lower losing 4.1%.
The Commodity equity group was all lower too losing 3.1%.
The DJ World index is now in a downtrend and lost 3.5%.
COMMODITIES
Bonds continue to uptrend gaining 0.6% on the week.
Crude is making new multi-year low and lost 11.3% on the week.
Gold is trying to uptrend but lost 0.9%.
The USD appears to be in a downtrend and lost 0.8%.
NEXT WEEK
Tuesday: the CPI, NY FED and NAHB. Wednesday: Building permits, Housing starts, Industrial production and the FOMC statement/conference. Thursday: weekly Jobless claims, the Philly FED and Leading indicators. Friday: options expiration. Best to your weekend and week!
CHARTS: http://stockcharts.com/public/1269446/tenpp
After about 40 years of investing in the markets one learns that the markets are constantly changing, not only in price, but in what drives the markets. In the 1960s, the Nifty Fifty were the leaders of the stock market. In the 1970s, stock selection using Technical Analysis was important, as the market stayed with a trading range for the entire decade. In the 1980s, the market finally broke out of it doldrums, as the DOW broke through 1100 in 1982, and launched the greatest bull market on record.
Sharing is an important aspect of a life. Over 100 people have joined our group, from all walks of life, covering twenty three countries across the globe. It's been the most fun I have ever had in the market. Sharing uncommon knowledge, with investors. In hope of aiding them in finding their financial independence.
Copyright © 2015 Tony Caldaro - All Rights Reserved Disclaimer: The above is a matter of opinion provided for general information purposes only and is not intended as investment advice. Information and analysis above are derived from sources and utilising methods believed to be reliable, but we cannot accept responsibility for any losses you may incur as a result of this analysis. Individuals should consult with their personal financial advisors.
Tony Caldaro Archive |
© 2005-2022 http://www.MarketOracle.co.uk - The Market Oracle is a FREE Daily Financial Markets Analysis & Forecasting online publication.