


Global Market Instability - Reversing the Damage of Economic Austerity
Stock-Markets / Stock Markets 2015 Dec 10, 2015 - 01:20 PM GMTBy: Clif_Droke

 A significant undercurrent of internal weakness is plaguing the NYSE broad market. This weakness is primarily visible in the dangerously high numbers of stocks making new 52-week lows. Lately that number has exceeded 300 on a daily basis, though it has been above 40 for the last few months in a sign that the market's health is less than optimal. The best way of showing this internal weakness is in the following exhibit which graphs the cumulative new 52-week highs and lows on the NYSE.
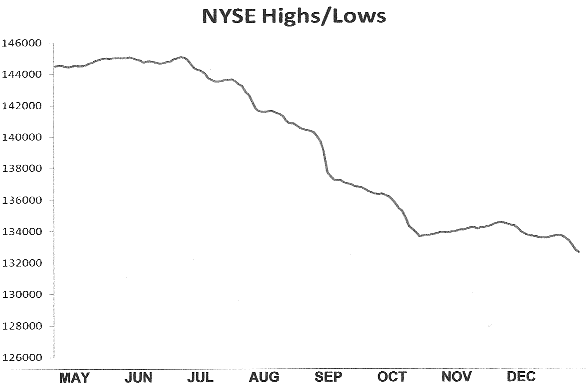
As you can see here, the new highs-new lows are in a sustained downward trend which suggests vulnerability to selling pressure in the stock market. A reversal of this downward trend is required to put the market back on a healthy track.
As potentially dangerous as this internal weakness is for the broad market in the near term, I still don't think it will prove fatal to the secular (long-term) bull market that began in 2009. This opinion is based on a qualitative analysis of the new NYSE 52-week lows: most of them are in the energy and natural resource sectors. The blame for the weakness in this area is mainly due to plunging prices for oil and other commodities. This in turn has put strain on firms who produce or market these commodities with spillover impact to other areas of the broad market.
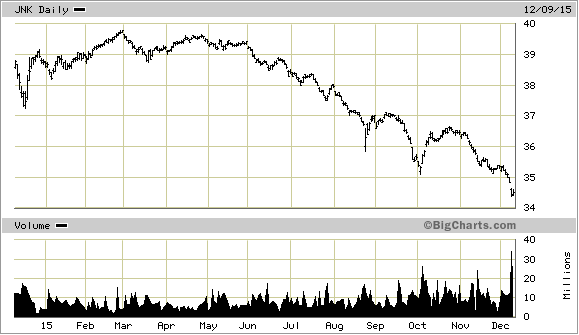
The residual influence of weak energy prices has also spilled over into the bond market. Below is the chart of the SPDR Barclays High Yield Bond ETF (JNK), which I use as a proxy for junk bond prices. Most of the weakness reflected in the junk bond market originates in the high-yield debt of energy companies.
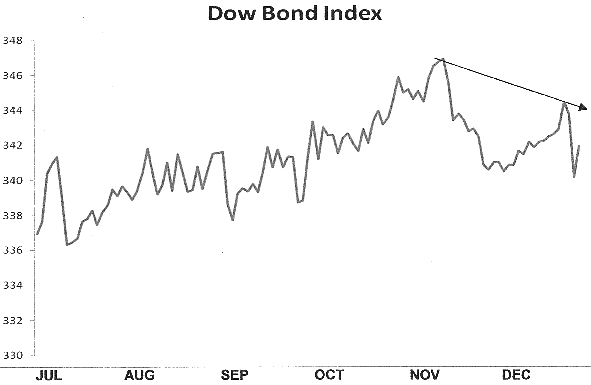
The weakness in the high-yield bond market is also spilling over into higher yielding corporate debt, as the Dow Jones Corporate Bond Index also reflects. See chart below.
I'm reminded of the 1997-98 experience which witnessed a similar scenario. In those days the U.S. stock market was in the midst of a powerful bull market, yet there was a negative undercurrent from the so-called "Asian contagion," i.e. the foreign currency crisis as well as soft commodity prices. Oil prices had plunged to $10/barrel while gasoline at the pump was just under $1/gallon. This proved to be a bonanza for U.S. consumers but put tremendous strain on countries that heavily depended on energy exports, such as Russia. The result was an increasing number of U.S. listed natural resource stocks which put strain on the broad market. The end result was a quick-but-nasty mini-bear market in the summer of 1998.
When finally the commodity market weakness was finally resolved in the fall of '98, the U.S. stock market entered the final year of the glorious 1990s bull market. In early 2000, the bull was over and a new bear market began.
What I'm suggesting is that we're probably witnessing something at least remotely similar. Most key industry groups which comprise the NYSE broad market are still in decent shape. It's primarily the commodity-heavy industries which are showing most of the weakness. If the bear market in commodities can be "washed out" by early 2016, it's possible the secular bull trend for equities can continue at least one more year.
The other major reason behind the recent broad market weakness is a case of the chills thanks to the global market weakness. Europe is one such area of global weakness. The ECB recently cut its deposit rate by the minimum amount expected, which did little to encourage investors that the central bank is serious about bolstering continent's economy and financial system. One is reminded of how the U.S. central bank responded to the growing credit crisis threat in December 2007. At that juncture investors were on edge and looked for guidance from the Fed. Instead of aggressively attacking the problem, however, Fed Chairman Bernanke announced a tepid quarter percent rate cut in December '07 which disappointed investors and which eventually catalyzed a plunge in equity prices.
Investors had hoped based on comments ECB President Draghi made in previous speeches that the ECB would increase its version of QE in order to help stimulate the euro zone financial markets, in turn helping the economy. Yet the ECB responded in the tepid fashion we've all grown accustomed to seeing in recent years. This is no way to calm the market and it's not surprising stocks, bonds and commodities have responded the way they have lately.
Looking back at a commentary I wrote on Dec. 8, 2011 I was surprised to find how little things have changed since then. I wrote, "If Mr. Draghi believes the euro zone won't eventually be torn apart by the debt crisis he is sadly mistaken and would appear to be severely underestimating the severity of the problem confronting him. And if he believes that 'budget discipline' (read austerity) is the key to successfully dealing with the debt crisis at this stage he is further mistaken. The time for budget discipline is long since passed; now is the time for aggressive action. One can only hope that the central bankers of Europe have learned something from our own credit crisis in 2007-2008, namely the importance of preemptive monetary policy action. Failure to take action right now, when Mr. Draghi still has the option, will result in remorse down the road."
China didn't help matters by slamming on the brakes of its real estate market boom. China's leaders enacted their own version of tight money by increasing strictures on equity and real estate investors. Japan's government meanwhile proverbially shot its economic recovery in the foot by increasing taxes, essentially undermining a successful QE measure.
When will the world's central banks get their acts together and re-synchronize monetary policy for maximum global impact? Your guess is as good as mine, but there are signs that at least the ECB, and possibly the People's Bank, are slowly waking up to the mistakes of recent years. How quickly they act upon this realization is a matter of speculation, though. Hopefully the New Year will witness a renewed resolve on the part of both banks to reverse the damaging austerity and tight money policies which have caused so much grief.
In the meantime, the only safe remedy for global market instability is continued patience and prudence in one's investing discipline. The equity market will work through the commodity market and global economic weakness and will, I believe, resume its bullish trend at some point next year. Until the NYSE new 52-week high-low index tells us that the broad market internal weakness has been completely reversed, however, investors should maintain a healthy skepticism for what may appear, at first glance, to be buying opportunities in the stock market. Only when the internal condition of the broad market decisively improves will the odds favor embracing risk.
Mastering Moving Averages
The moving average is one of the most versatile of all trading tools and should be a part of every investor's arsenal. Far more than a simple trend line, it's also a dynamic momentum indicator as well as a means of identifying support and resistance across variable time frames. It can also be used in place of an overbought/oversold oscillator when used in relationship to the price of the stock or ETF you're trading in.
In my latest book, Mastering Moving Averages, I remove the mystique behind stock and ETF trading and reveal a simple and reliable system that allows retail traders to profit from both up and down moves in the market. The trading techniques discussed in the book have been carefully calibrated to match today's fast-moving and sometimes volatile market environment. If you're interested in moving average trading techniques, you'll want to read this book.
Order today and receive an autographed copy along with a copy of the book, The Best Strategies for Momentum Traders. Your order also includes a FREE 1-month trial subscription to the Momentum Strategies Report newsletter: http://www.clifdroke.com/books/masteringma.html
By Clif Droke
www.clifdroke.com
Clif Droke is the editor of the daily Gold & Silver Stock Report. Published daily since 2002, the report provides forecasts and analysis of the leading gold, silver, uranium and energy stocks from a short-term technical standpoint. He is also the author of numerous books, including 'How to Read Chart Patterns for Greater Profits.' For more information visit www.clifdroke.com
Clif Droke Archive |
© 2005-2022 http://www.MarketOracle.co.uk - The Market Oracle is a FREE Daily Financial Markets Analysis & Forecasting online publication.