


Elliott Wave Analysis of SPX Stock Market
Stock-Markets / Stock Markets 2015 Nov 30, 2015 - 03:26 PM GMT

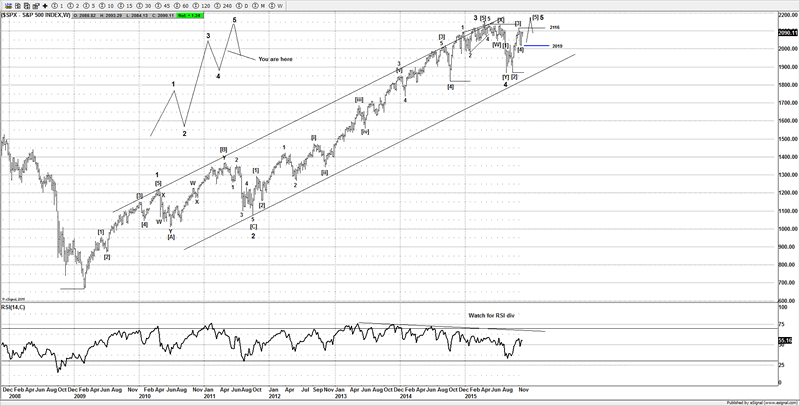
 I decided to switch ideas, although I am happy to switch back should we see a solid break under 2019SPX, the lack of downside is supporting the market is most likely in wave 5 and not still in wave 4, initially I was looking for a decline to either 1900SPX for wave [C] of a triangle or even 1850SPX for wave [C] of a flat pattern to end wave 4 on the weekly charts. But the reluctance to break down a few weeks back is strongly suggesting it's most likely in wave 5 and further more it could well be inside in wave [5] of 5 as shown.
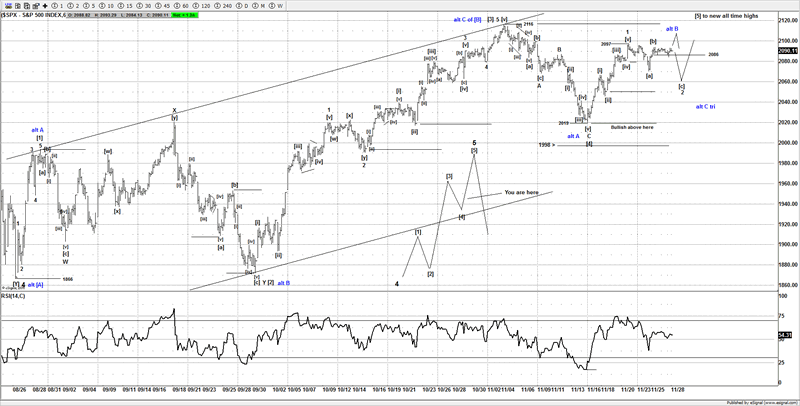
S&P500 Daily Chart
Short term it's a bit messy around the Aug 2015 lows, but I have found a way to count it, so if the market is actually in wave 5 (the only issue is the NIK225, USDJPY and DAX look out of sync with this idea) Then I favor its still inside wave [4] as a possible triangle, but if fails to move under 2055-60SPX, then any dip could be a [c] wave of wave 2 for a flat pattern, if however we see a 3 wave move from 2019SPX and a small spike into the 2100 - 2110SPX area, then a swift reversal back below 2100SPX and remains below 2100SPX, then it can still suggest its inside wave [4] and possibly decline towards 2040SPX for wave C of a triangle. There are a few options and until I get some more price action I don't have a clear idea, but I can say that staying above 2019SPX is supporting the idea it's in wave 5 of the weekly wave count, so should see more upside regardless if its inside wave [4] of 5 or now in wave [5] of 5.
S&P500 Weekly Elliott Wave Chart
If it actually fails to move above 2116SPX it could still support more downside and even a possible break under 2019SPX which would bring the previous ideas we were working and a decline towards 1900SPX for wave [C] of a larger triangle into play, but as long as its above 2019SPX the bulls are firmly in charge on the weekly charts...
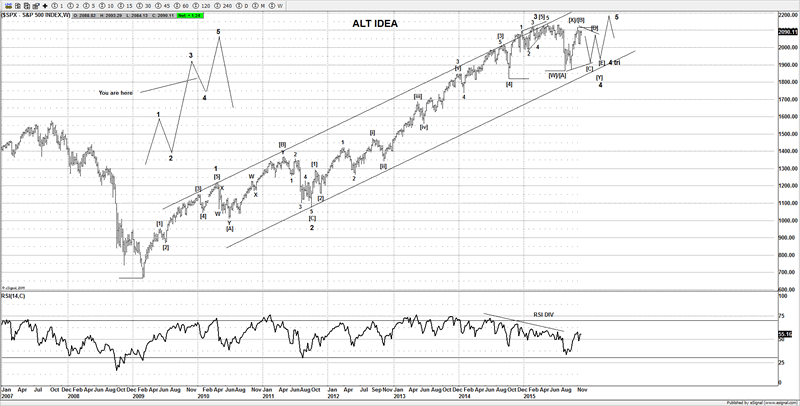
Alt idea
S&P500 Alternate Weekly Elliott Wave Chart
Until next time,
Have a profitable week ahead.
Click here to become a member
You can also follow us on twitter
What do we offer?
Short and long term analysis on US and European markets, various major FX pairs, commodities from Gold and silver to markets like natural gas.
Daily analysis on where I think the market is going with key support and resistance areas, we move and adjust as the market adjusts.
A chat room where members can discuss ideas with me or other members.
Members get to know who is moving the markets in the S&P pits*
*I have permission to post comments from the audio I hear from the S&P pits.
If you looking for quality analysis from someone that actually looks at multiple charts and works hard at providing members information to stay on the right side of the trends and making $$$, why not give the site a trial.
If any of the readers want to see this article in a PDF format.
Please send an e-mail to Enquires@wavepatterntraders.com
Please put in the header PDF, or make it known that you want to be added to the mailing list for any future articles.
Or if you have any questions about becoming a member, please use the email address above.
If you like what you see, or want to see more of my work, then please sign up for the 4 week trial.
This article is just a small portion of the markets I follow.
I cover many markets, from FX to US equities, right the way through to commodities.
If I have the data I am more than willing to offer requests to members.
Currently new members can sign up for a 4 week free trial to test drive the site, and see if my work can help in your trading and if it meets your requirements.
If you don't like what you see, then drop me an email within the 1st 4 weeks from when you join, and ask for a no questions refund.
You simply have nothing to lose.
By Jason Soni AKA Nouf
© 2015 Copyright Jason Soni AKA Nouf - All Rights Reserved
Disclaimer: The above is a matter of opinion provided for general information purposes only and is not intended as investment advice. Information and analysis above are derived from sources and utilising methods believed to be reliable, but we cannot accept responsibility for any losses you may incur as a result of this analysis. Individuals should consult with their personal financial advisors.
WavePatternTraders Archive |
© 2005-2022 http://www.MarketOracle.co.uk - The Market Oracle is a FREE Daily Financial Markets Analysis & Forecasting online publication.