UK Regional House Prices, Cheapest and Most Expensive Property Markets
Housing-Market / UK Housing Nov 23, 2015 - 04:01 AM GMTBy: Nadeem_Walayat
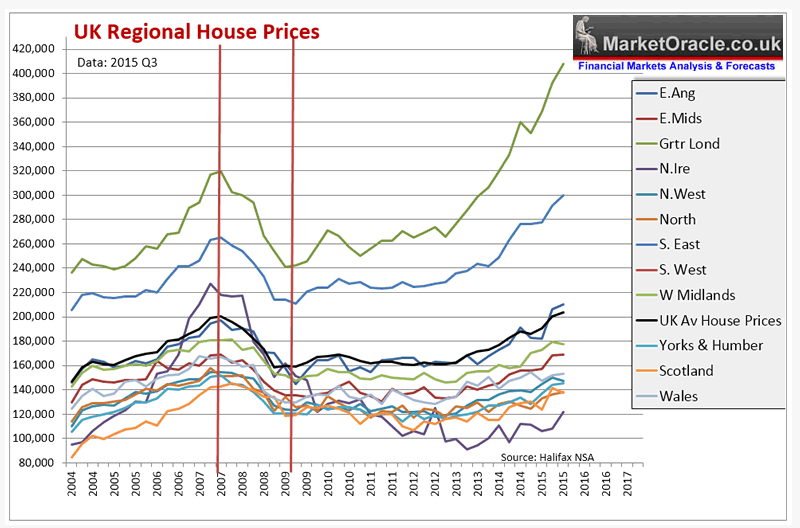
 Average UK house prices have now risen by 30% from the 2009 bear market low to currently stand at an average price of £204,119 (Halifax NSA Oct 2015), and are currently galloping along at an annual inflation rate of 10%. However, the UK average price masks huge regional variations in trend and momentum most notable of which is that London has literally soared into the stratosphere, up over 70% on it's bear market low and by virtue of which has pulled the average UK house price indices higher as illustrated by the below graph.

I will come back to London's housing market mania in detail in a separate article whilst in this analysis my focus will be on what is taking place in the regions which have so far lagged far beyond London's mania.

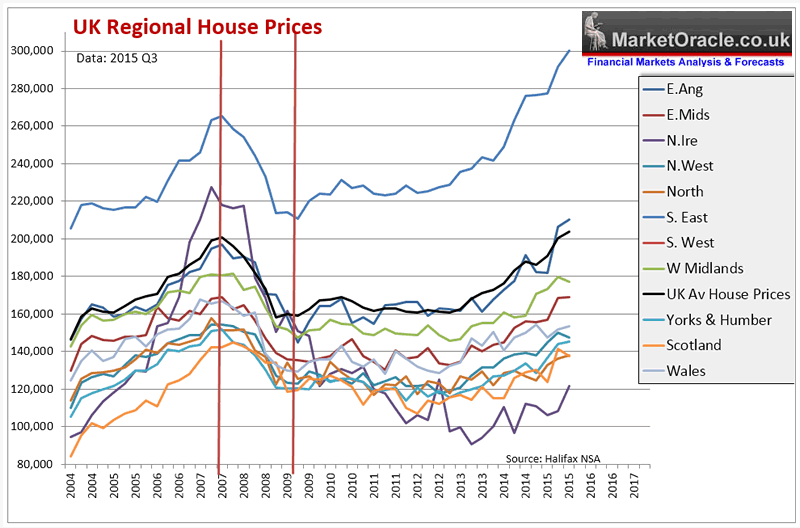
The most obvious pattern being observed is that the nearer a region is to London then the greater the house price inflation experienced. Therefore London is acting as the bull market's epicentre that is rippling out waves of capital which are mostly absorbed by the surrounding South East region then the next nearest regions, all the way to Britain's most furthest region, Scotland which was not helped by Scotland's attempted suicide that was the 2014 Independence Referendum which held Scotland's housing market back until after the election outcome.
Whilst Northern Ireland, the smallest UK region has observed the greatest volatility given its heavy reliance on central government spending so as to help prevent the locals from once again sparking civil conflict. Northern Ireland saw prices reach a bubble mania peak of £227,000 in 2007, which was followed by an equally spectacular collapse to just £90k as recently as mid 2013, the last to bottom, with the subsequent trend to £121k attempting to play catchup with the rest of the UK.
Apart from the South East, the rest of the UK's regions tend to lag behind the UK average, nevertheless some of the current deviations are at extremes when compared against the averages of the past 20 years, thus offering investor possibilities as well as warnings:
| E.Ang | E.Mids | N.Ire | N.West | North | Wales | |
| Historic | -1% | -15% | -22% | -23% | -25% | -19% |
| Current | 3% | -17% | -40% | -28% | -32% | -25% |
| 4% | -2% | -18% | -4% | -7% | -6% |
| S West | S. East | UK Av | W Midlands | Yorks & Humb | Scotland | |
| Historic | 11% | 39% | 0% | -6% | -27% | -29% |
| Current | 5% | 47% | 0% | -13% | -29% | -33% |
| -5% | 8% | 0% | -7% | -2% | -4% |
South East
As expected the South East is the second most expensive UK region after London that is currently showing a +8% deviation against the long-term trend as the London bubble continues to spill over into the neighbouring towns and cities.
East Anglia
Again near to London means spill over of capital flooding in to East Anglia which is currently showing a +4% deviation against the long-term trend.
Northern Ireland
Historically NI tends to lag the UK average by -22%, the current lag is -40%, a deviation of -18% which shows that Northern Ireland is the UK's cheapest housing market. Though that does not mean a rapid bull run is imminent as government spending cuts will impact Northern Ireland harder than most regions which is thus reflected in house prices. Nevertheless the small size and volatility of Northern Irelands housing market does present an opportunity to profit from a future bubble blow off as occurred during 2007 i.e. by the time Northern Ireland peaks house prices could easily more than double from current levels.
The North, West Midlands and Wales
These three regions are all showing similar deviations from their expected trends of -6% to -7%, which is not so surprising given their relative distance from the London property bubble epicentre.
South West
The media often tends to over hype the impact of London capital pushing up South West house prices beyond the affordability of the locals. However, the South West is currently exhibiting a -5% deviation so reality is not quite match the media hype.
Scotland
The Scottish housing market has bounced back strongly following the near death experience of the Independence Referendum. And do far the oil price collapse has not done much damage to Scottish house prices which are only showing a -4% deviation against the average trend.
The Rest
The remaining regions are lagging between -2% and -4%, which should eventually play catchup against the over-extended regions. Of special note is York's and Humberside which is showing surprising relative strength by only exhibiting a -2% deviation which may in part be due to the prospects for HS2 and HS3, but definetly something positive is brewing in York's and Humber which is also one of my favourite UK locations for the emergence of a NEW mega-city (MANFIELD).
Another point to mention is to expect stronger house price inflation in the major cities than towns and villages, and of course especially the affluent areas of cities that on average will be experiencing a positive deviation to the UK average i.e. far out performing their regional averages.
The bottom line is that at this point in time Northern Ireland represents the best value for money in terms of long-term investment opportunities, whilst the South East is expensive when compared against the rest of the UK but not when compared against London which will be the focus of my next article.
UK House Prices 5 Year Forecast
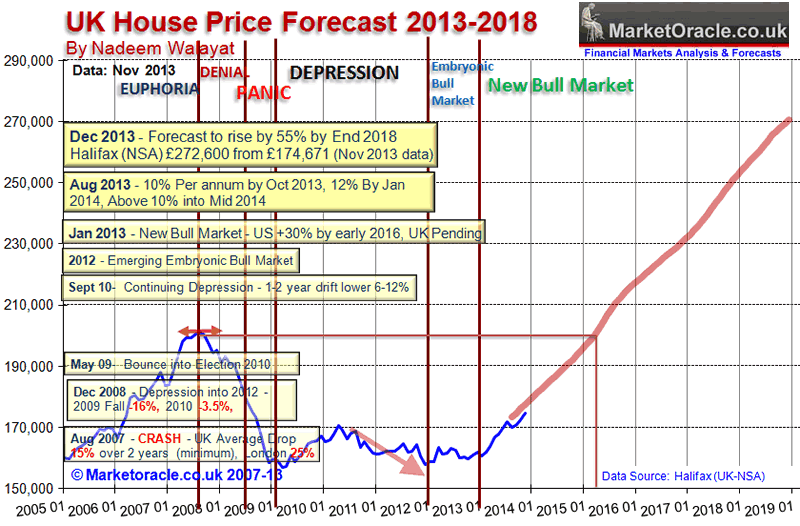
It is now 23 months since excerpted analysis and the concluding 5 year trend forecast from the then forthcoming UK Housing Market ebook was published as excerpted below-
UK House Prices Forecast 2014 to 2018 - Conclusion
This forecast is based on the non seasonally adjusted Halifax House prices index that I have been tracking for over 25 years. The current house prices index for November 2013 is 174,671, with the starting point for the house prices forecast being my interim forecast as of July 2013 and its existing trend forecast into Mid 2014 of 187,000. Therefore this house prices forecast seeks to extend the existing forecast from Mid 2014 into the end of 2018 i.e. for 5 full years forward.
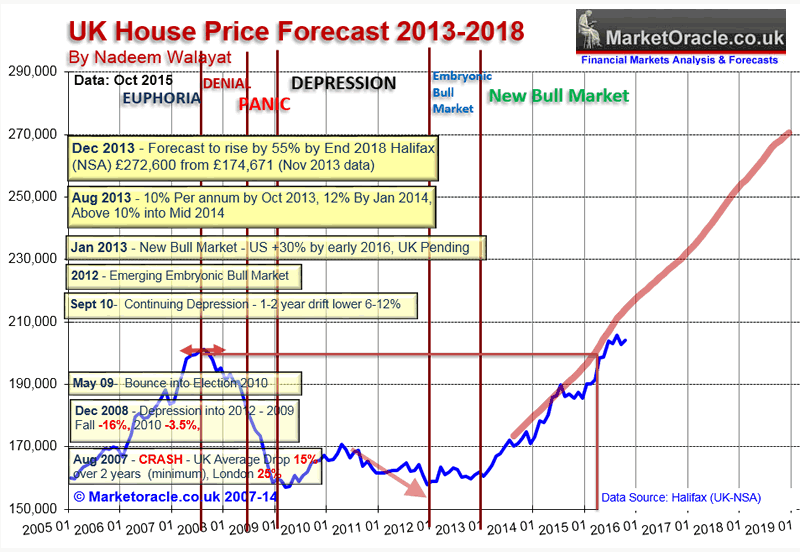
My concluding UK house prices forecast is for the Halifax NSA house prices index to target a trend to an average price of £270,600 by the end of 2018 which represents a 55% price rise on the most recent Halifax house prices data £174,671, that will make the the great bear market of 2008-2009 appear as a mere blip on the charts as the following forecast trend trajectory chart illustrates:

In terms of the current state of the UK housing bull market, the Halifax average house prices (NSA) data for Oct 2015 of £204,119 is currently showing a 4.5% deviation against the forecast trend trajectory (+17%), which if it continued to persist for the term of the 5 year forecast for a 55% rise in average UK house prices by the end of 2018 would translate into an 11% reduction in the forecast outcome to approx a 44% rise.

The bottom line is that the mega-trend drivers of out of control immigration, lack of house building, flood of foreign capital, and the UK governments perpetual inflation of the debt bubble ensures that the UK housing bull market will continue despite any hits such as that which the buy to let sector is taking.
Ensure you are subscribed to my always free newsletter for ongoing in-depth analysis and concluding detailed trend forecasts that include the following planned newsletters -
- London House Prices
- US House Prices
- US Dollar Trend Forecast
- Stock Market 2016
- Islam 3.0
 Also subscribe to our Youtube channel for notification of video releases and for our new series on the 'The Illusion of Democracy and Freedom', that seeks to answer questions such as 'Did God Create the Universe?' and how to 'Attain Freedom' as well as a stream of mega long term 'Future Trend Forecasts'.
By Nadeem Walayat
Copyright © 2005-2015 Marketoracle.co.uk (Market Oracle Ltd). All rights reserved.
Nadeem Walayat has over 25 years experience of trading derivatives, portfolio management and analysing the financial markets, including one of few who both anticipated and Beat the 1987 Crash. Nadeem's forward looking analysis focuses on UK inflation, economy, interest rates and housing market. He is the author of five ebook's in the The Inflation Mega-Trend and Stocks Stealth Bull Market series that can be downloaded for Free.
 Nadeem is the Editor of The Market Oracle, a FREE Daily Financial Markets Analysis & Forecasting online publication that presents in-depth analysis from over 1000 experienced analysts on a range of views of the probable direction of the financial markets, thus enabling our readers to arrive at an informed opinion on future market direction. http://www.marketoracle.co.uk
Disclaimer: The above is a matter of opinion provided for general information purposes only and is not intended as investment advice. Information and analysis above are derived from sources and utilising methods believed to be reliable, but we cannot accept responsibility for any trading losses you may incur as a result of this analysis. Individuals should consult with their personal financial advisors before engaging in any trading activities.
Nadeem Walayat Archive |
© 2005-2022 http://www.MarketOracle.co.uk - The Market Oracle is a FREE Daily Financial Markets Analysis & Forecasting online publication.


