


Gold And Silver - Value Of Knowing The Trend
Commodities / Gold and Silver 2015 Nov 21, 2015 - 01:52 PM GMTBy: Michael_Noonan

 Every once in a while, we reiterate the importance of knowing the trend, in fact, calling the trend the number one piece of information. From it, everything else follows, in terms of knowing in which direction to base trade decisions.
2014 and 2015 were viewed as turnaround years for gold and silver, with expectations that price would rally to new, never before seen prices. In a little over a month, 2015 ends and 2016 begins right after. It is possible that 2016 may bring more of the same: disappointing expectations for PMs performance. It is just a possibility, for no one knows for certain how the future will unfold. What we do know for certain is that in order for PMs to rally, they must first stop going down.
We have been telling readers to avoid the long side in futures for the past few years. We are also on record for advocating the purchase of physical gold and silver at any price, and all purchases made in the past few years are likely in the red. While true, that is not the issue in owning the physical for the reasoning is totally different. Physical ownership is more a form of insurance against the failure of the fiat Federal Reserve Note, aka the "dollar."
Reference was made to holding physical gold and silver as a form of wealth preservation. Some, perhaps even many may think their wealth is not being preserved very well for those purchases made since the PM peak, 5 years ago. This is true, in absolute terms when using a fiat currency as one's measure. It is a testament to the ability of the globalists to keep a price lid on both gold sand silver, mainly through the US central bankers. Few believed the financial Ponzi scheme could be stretched as much as it has.
What we all have learned is to realize the importance of a fiat trend, as well as a market trend. When the fiat trend ends, the doors may close for the ability of one to buy more physical gold and silver, and the purchases made, even currently showing a loss in value, will be a saving grace after a temporary price disadvantage. Do not be discouraged and continue to buy more as one can.
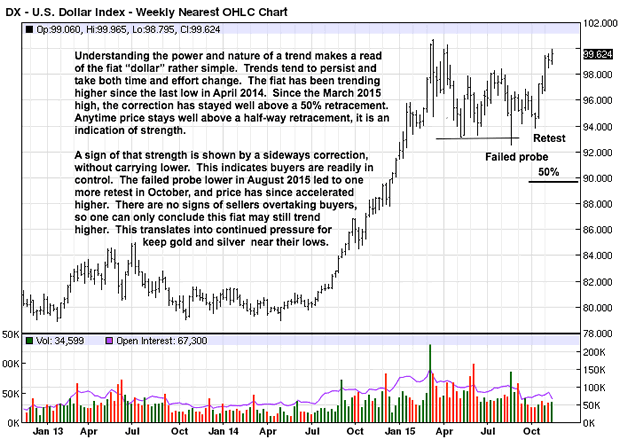
All fiats fail, and the only difference this time around is the grossly exaggerated extent to which fiat has managed to survive. It also indicates that once the fiat "dollar" fails, and there are more and more cracks showing up in its ability to maintain its world reserve currency status, the move for physical gold and silver will also be favorably exaggerated to the upside.
The fiat "dollar" chart does not show any ending action to the upside. The last two TDs [Trading Days], were narrow ranges: buyers were unable to extend higher, but at the same time, sellers were unable to take advantage so buyers continue to prevail and price should eventually carry higher. The only thing that can alter this assessment is if sellers suddenly show up in force. They have not yet, so mention is made only to recognize the possibility.
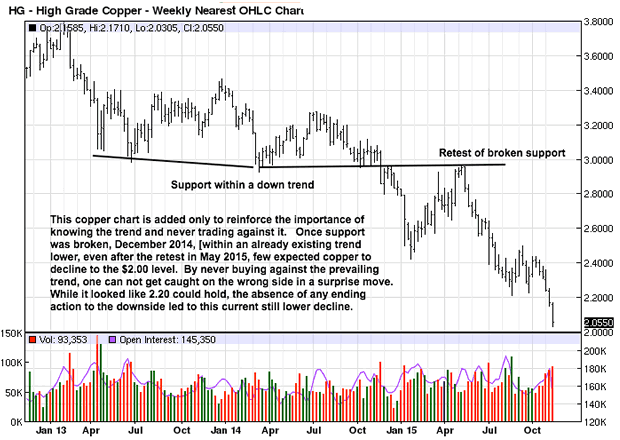
The only purpose for including the weekly copper chart is to show how once a trend is established, it carries the prevalent momentum until the opposing force[s] become strong enough to effect a change. If that does not happen, you can see price will keep falling, more than most expected, and will continue to fall until it uncovers demand. Unless demand shows up soon, $2 copper is possible for as long as the trend remains down.
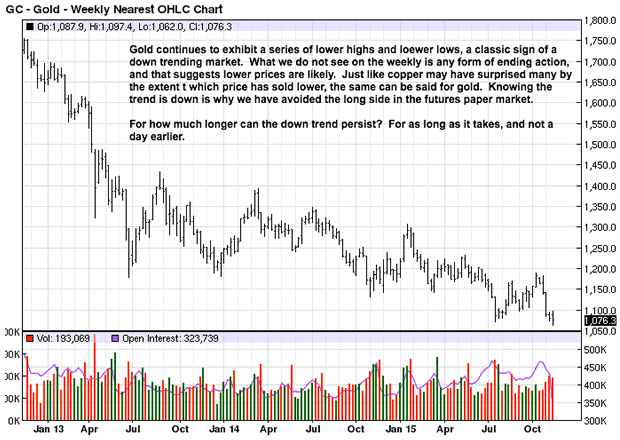
Gold's decline is more controlled, no pun intended, as the lower lows do not go as deep as prior swing lows, which means the downside is just slowly giving way, but still going lower. This remains a function of price seeking demand, and until it shows up, just like in copper, price will continue to make lower lows.
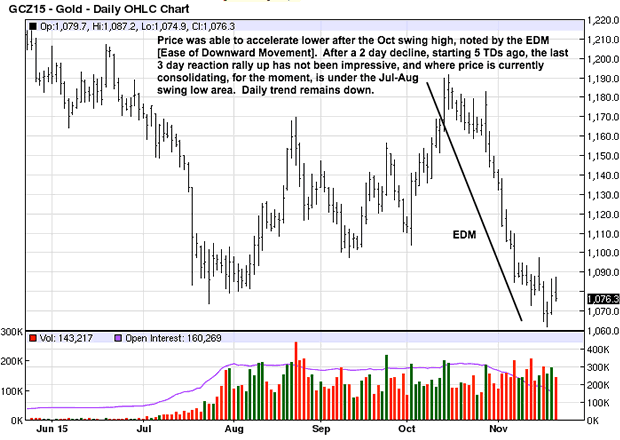
The first two of the last four TDs were sharp declines, the last two on much smaller bars but volume increased. This would be an indication that buyers were more than able to match the increased selling effort sufficiently to prevent price from extending lower. More than likely the buying is short-covering and not new buyers. If true and the next rally is weak, without new buying for support, price will decline still more.
Because we know the trend is down, there is no guesswork about trading from the long side in paper gold. There is no need to "predict" the price direction. Just wait for more information that buyers are beginning to increase [which they are not, so far], and then have a strategy for buying in a changing up trend. Presently, there is no evidence of a change to an up trend, so wait for confirmation and keep one's powder dry.
The EDM reflects how buyers cannot control selling. While price started to trade almost sideways, near the current lows, you can see, relative to the $120 decline from the last swing high, there has been no ability to mount a counter-rally, and that is a sign of weakness.
Any change always shows up first on the smaller time frames. Yet, even the intra day 60 minute chart shows no sign of ending the current decline. Read all you want about the bullish fundamental climate for gold and silver, the reality is market participants are ignoring the current news and dealing with where price is and is headed. This is why charts are always more reflective of what is going on, at all times.
Just like there was no ability to rally from the lows in daily gold, weekly silver is in a similar position. Last week's tiny range is hard to read: price could neither rally nor decline, a stalemate. The trend is down, and the onus for change is with the buyers.
Until buyers make their presence known, expect more of the same.
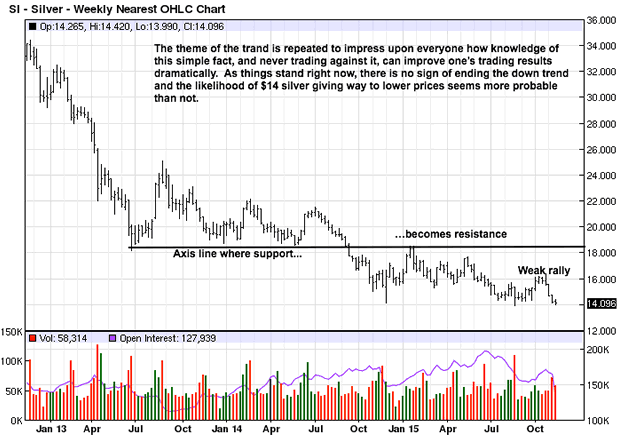
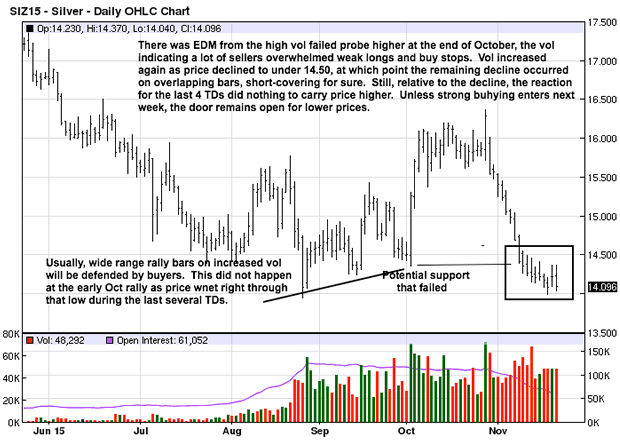
The rally in early October was on wider range bars and sharply increased volume. It shows where buyers stepped in and made a difference. Typically, buyers will defend those prices, anywhere from the top of the first wide range bar to the bottom of it. That potential support was totally ignored as price declined over the last several TDs, and that says weakness.
Relative to the decline that started in late October, at a bull trap failed probe higher, once at the bottom of the current decline, there has been no ability to counter-rally. All of these observations are nothing more than reading developing market activity. They are simple and factual messages the market is conveying. These messages clear the fog formed from sentimental beliefs.
Jettison the beliefs and stay with what the market says. Trading life becomes easier.
By Michael Noonan
Michael Noonan, mn@edgetraderplus.com, is a Chicago-based trader with over 30 years in the business. His sole approach to analysis is derived from developing market pattern behavior, found in the form of Price, Volume, and Time, and it is generated from the best source possible, the market itself.
© 2015 Copyright Michael Noonan - All Rights Reserved Disclaimer: The above is a matter of opinion provided for general information purposes only and is not intended as investment advice. Information and analysis above are derived from sources and utilising methods believed to be reliable, but we cannot accept responsibility for any losses you may incur as a result of this analysis. Individuals should consult with their personal financial advisors.
Michael Noonan Archive |
© 2005-2022 http://www.MarketOracle.co.uk - The Market Oracle is a FREE Daily Financial Markets Analysis & Forecasting online publication.