US Stocks Snorting Bull Market
Stock-Markets / Stock Markets 2015 Oct 26, 2015 - 02:25 PM GMT I have some free time tonight and the better part of the day tomorrow to post a few charts before I have to catch my flight home on Tuesday. I just want to thank you again for you patience.
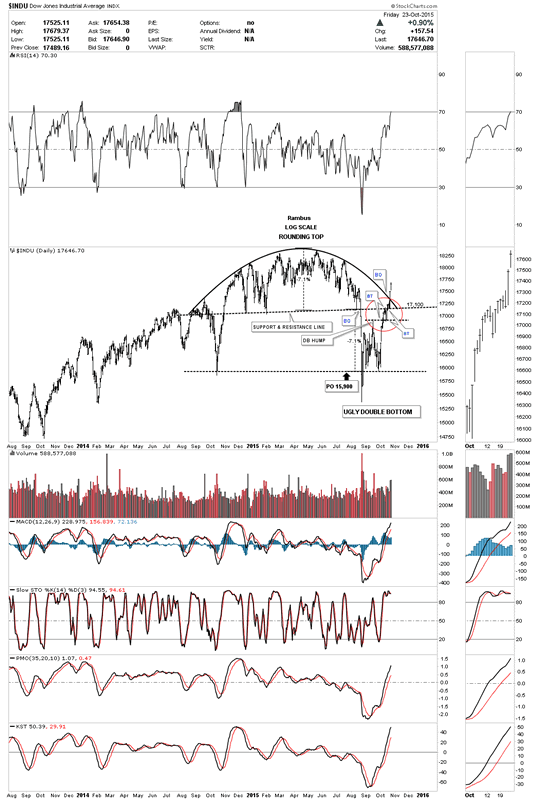
Lets take a quick look at the daily INDU chart I posted on Wednesday that now shows the breakout of the rounding top trendline. So far so good.
Dow Jones Industrial Average Daily Chart
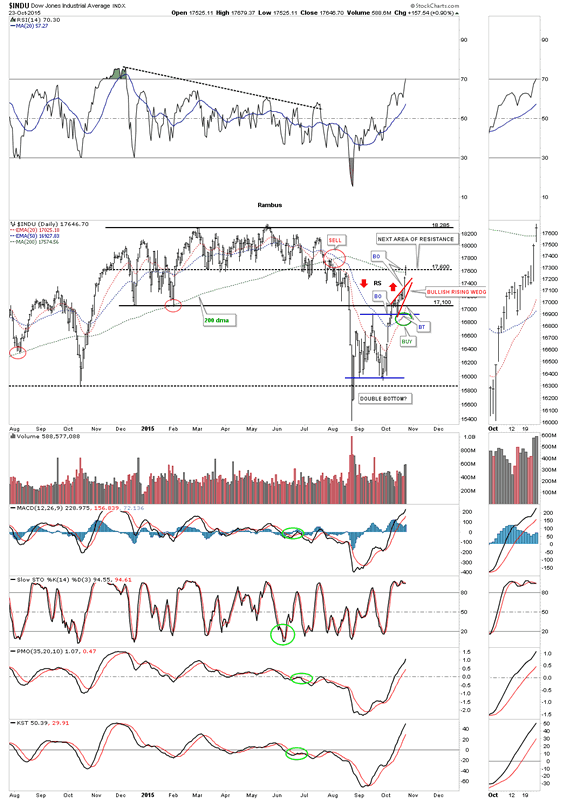
Below is another daily chart which shows the horizontal support and resistance lines. Currently the 17,600 S&R line may act as short term resistance to allow the INDU to catch its breath before moving higher. As you can see there was a breakout of a small red bullish rising wedge which took out the top rail to the upside last Thursday. That little red bullish rising wedge formed just below the rounding top trendline we looked at on the chart above which is also bullish. Friday's price action gapped above the 200 dma also. We had a bullish cross of the 20 ema and 50 ema last week as well. There is a lot of positive price action on this chart below.
Dow Jones Industrial Average Daily Chart 2
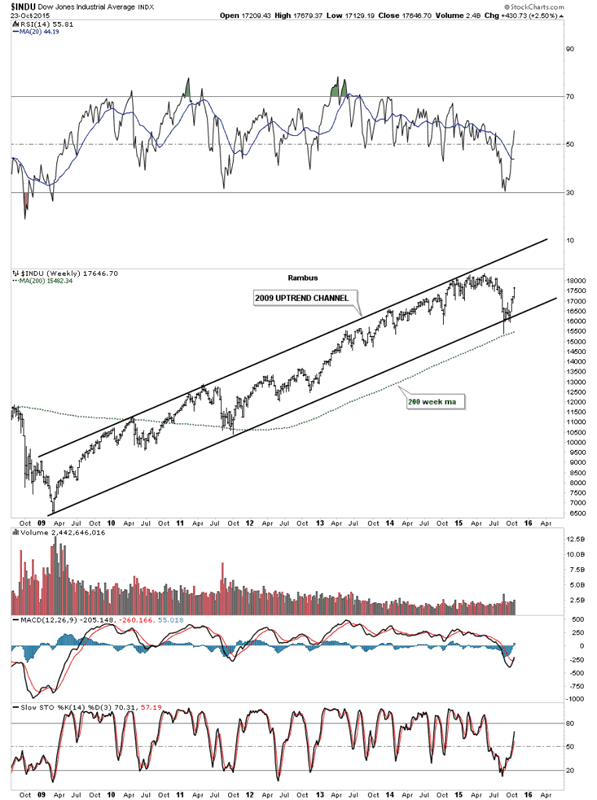
The weekly chart for the INDU shows the 2009 uptrend channel we looked at when it was testing the bottom rail during the August low. This chart is one of the reasons I've remained bullish during this correction, above the bottom trendline is bullish and below is bearish. Outside of the August low this uptrend channel really shows a beautiful bull market.
Dow Jones Industrial Average Weekly Chart
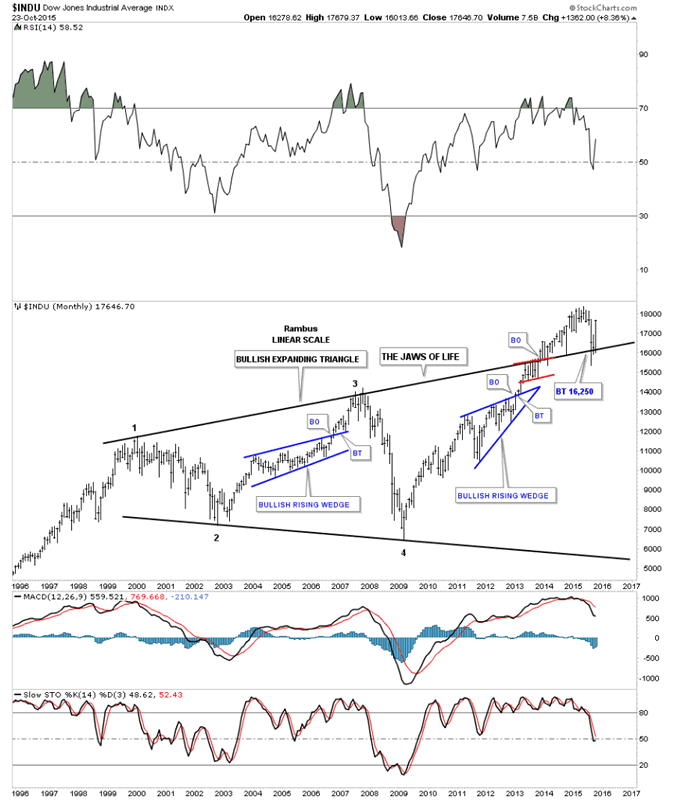
Another big reason I've remained bullish on the stock markets is the monthly chart for the INDU, The Jaws of Life, chart. I know a lot of folks have given up on this massive consolidation pattern but until the INDU closes below that very important top trendline, on a monthly closing basis, I have to respect the potential of this consolidation pattern.The top rail was strongly backtested during the August low but it held support again. Depending on what the INDU does this next week it could be one of the biggest monthly gains since the bull market began in 2009.
Dow Jones Industrial Average Monthly Chart
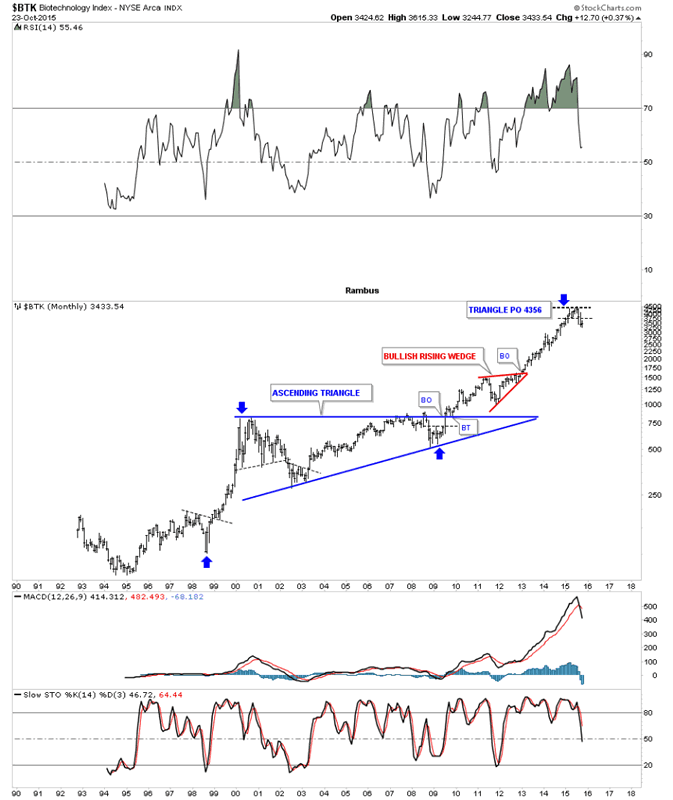
As you know I've been showing you a lot of very long term monthly charts for many individual stocks that are also showing massive consolidation patterns. Below is the $BTK, biotechnology index, which shows you a perfect example of what this pattern looks like. The $BTK built out a massive 9 year flat top or ascending triangle which broke to the upside in late 2009 when everything else was bottoming. The 2009 low, which was the fourth reversal point, hardly shows up on this chart which shows us its relative strong performance vs most of different sectors in the stock markets at that time. The blue arrows measures the price objective using the blue triangle as a halfway pattern. As you can see that price objective has been met at 4356. Since the price objective has been met this tells us the $BTK may now under preform some of the weaker areas of the markets as money rotates into some of the lagging sectors.
BTK Monthly Chart
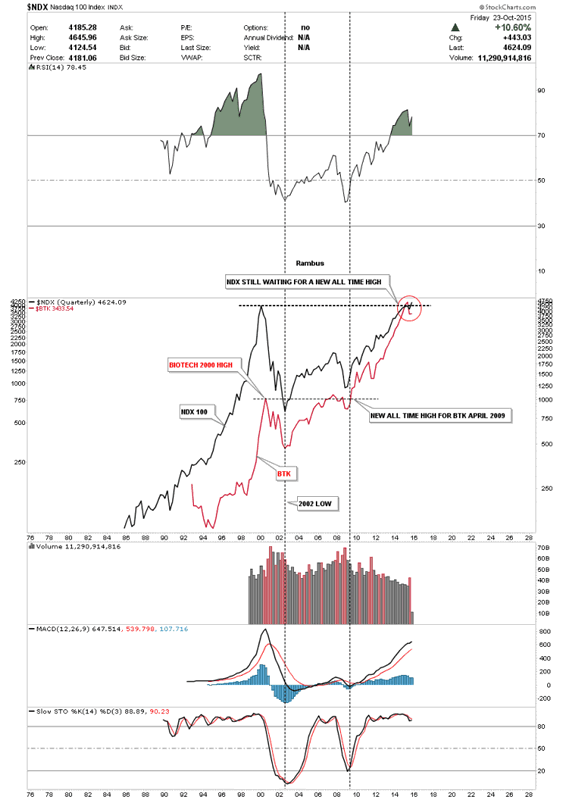
Below is a long term quarterly chart that compares the $NDX to the $BTK going back 30 years or so. They both topped out together in 2000 and bottomed together in 2002 which is what you would expect. Now lets focus in on the rally out of the 2009 crash low. This is the point where the biotech stocks really started to outperform the big tech stocks. As you can see the $BTK broke to new all time highs in 2009 while the $NDX was just bouncing off of its bottom. Since that point they both have been in a strong bull market but the big difference is that the $NDX is now just reaching its all time highs. This is an old chart but the red circle now shows the $NDX is trading into new all time highs using a quarterly line chart. Again I expect both of these sectors to rise but this time the $NDX, big cap tech stocks, will out perform the biotech stocks on a relative basis. I believe the bull market will continue higher as capital rotates into the under performing sectors like the semiconductors and networking stocks. Other under performing sectors should also benefit from this move. This is how a bull market lives on. At some point the bull will die but not before most of the different sectors have their own individual bull market.
NDX and BTK Quarterly Chart
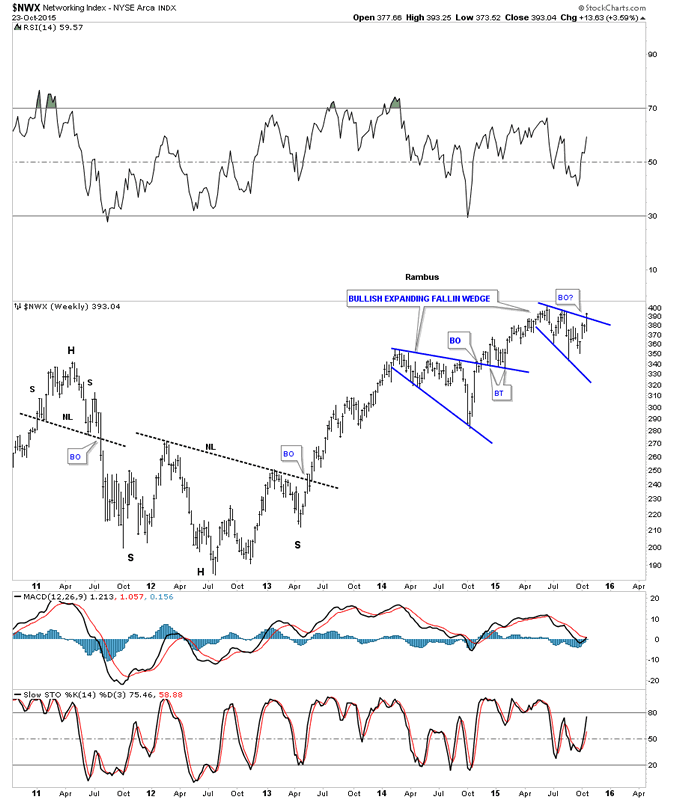
Looking at a weekly chart for the $NWX, networking index, it's shows the price action breaking out of a bullish expanding falling wedge last week.
NWX Weekly Chart
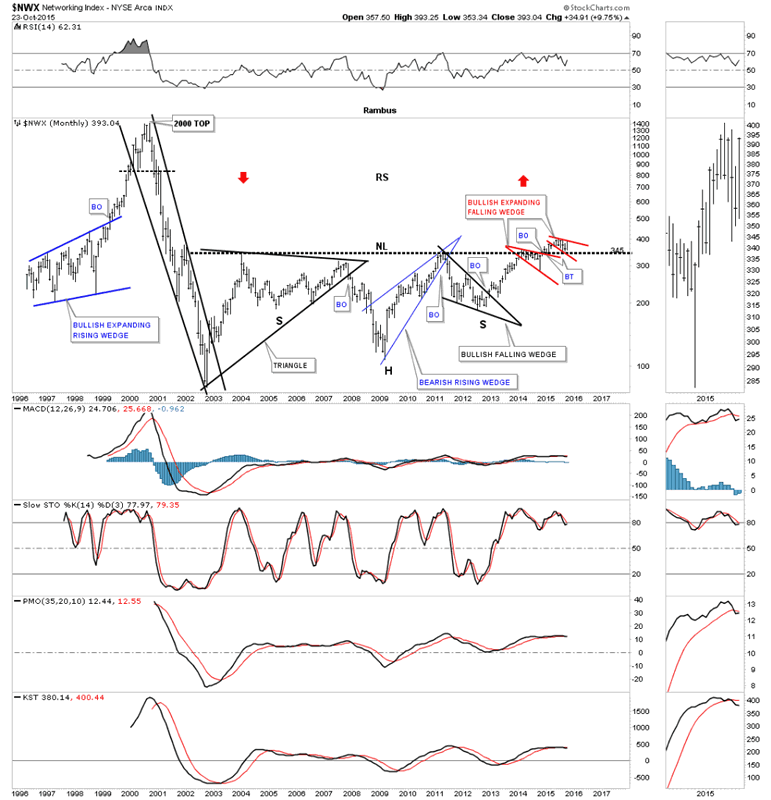
The monthly chart for the $NWX shows a very bullish setup. Note the 2 blue bullish expanding falling wedges that formed on the weekly chart above. What makes the setup so bullish is that one of the bullish expanding falling wedges formed below the massive 12 year H&S bottom neckline and the other is forming above that massive neckline. With that massive base completing we could very well see some reverse symmetry to the upside as shown by the red arrows. Above the neckline at 345 is bullish and below is bearish which marks a great line in the sand.
NWX Monthly Chart
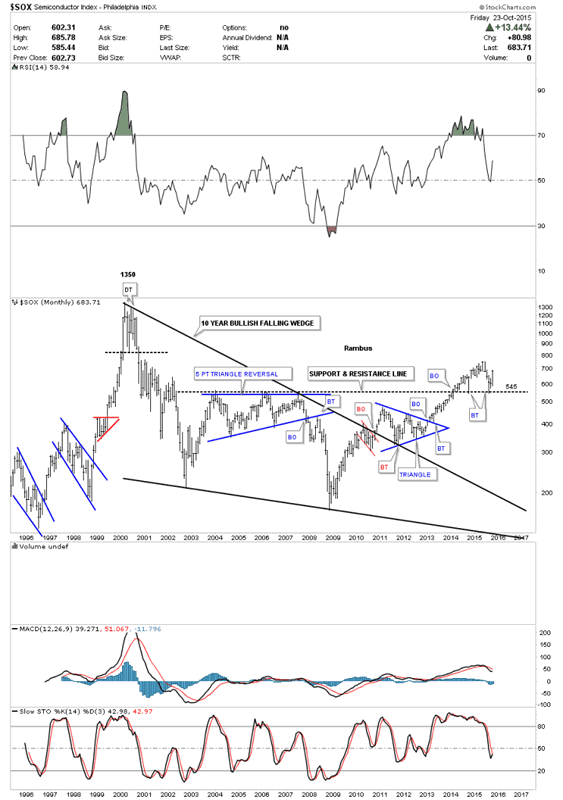
The long term monthly chart for the $SOX, semiconductor index, shows it broke out of a massive black 10 year bullish falling wedge in late 2010 or so. Note the blue triangle that formed right on the top rail of that 10 year black bullish falling wedge which was a bullish setup. The current support and resistance line comes in at 545 which was the top rail of the blue 5 point triangle reversal pattern that formed between 2004 and 2007. This chart shows some nice Chartology with the different technical formation. The two blue triangles shows a nice clean breakout with an equally clean backtest. Once the $SOX broke above the black dashed S&R line at 545 it has held support twice now. I know many are looking at the current price action as a possible H&S top but the individual stocks that make up this index don't show a bearish setup.
SOX Monthly Chart
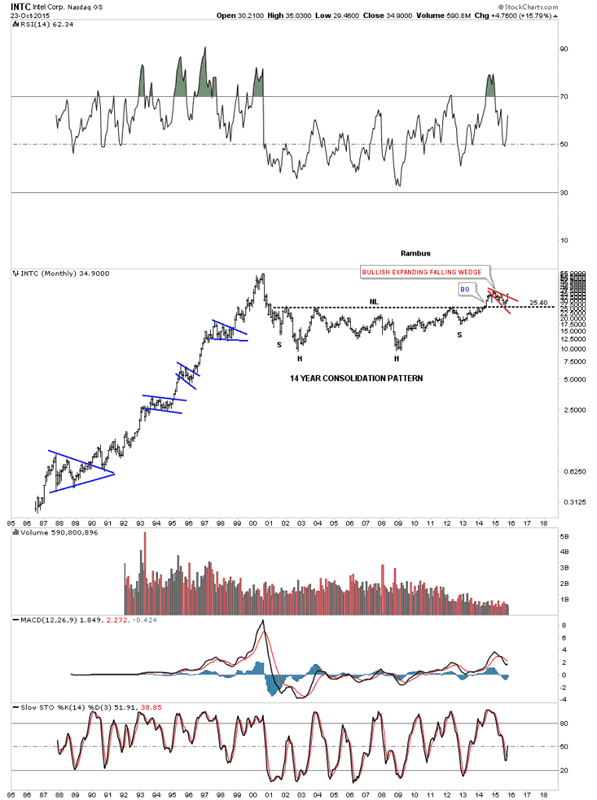
The long term monthly chart for INTC shows its massive double headed 14 year H&S consolidation pattern. Note the little red bullish expanding falling wedge that has formed right on top of the neckline which is a bullish setup.
Intel Monthly Chart
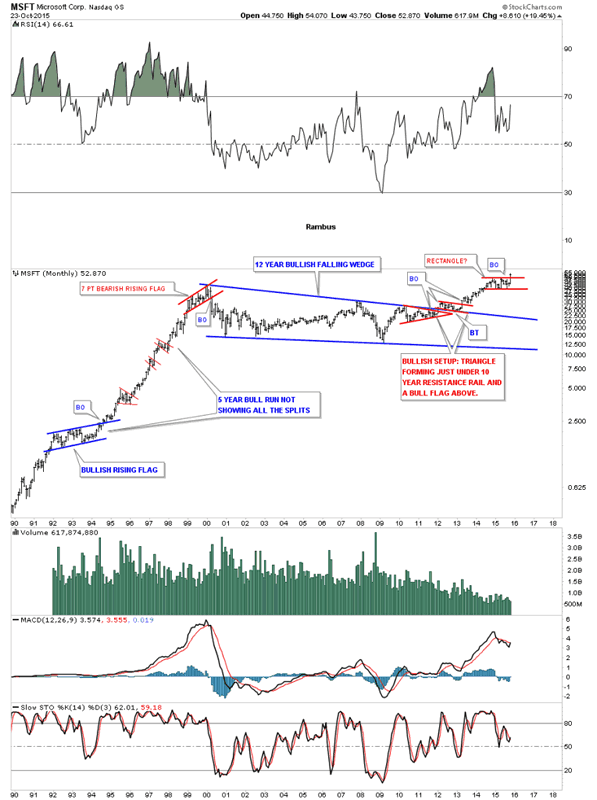
I've been showing you this monthly chart for Mr. Softy for several years now. It built out a beautiful 12 year blue bullish falling wedge. Note the two small red consolidation patterns that formed one below the top rail and one above the top rail of the bullish falling wedge. Last week MSFT broke out of a blue rectangle consolidation pattern to the upside.
Microsoft Monthly Chart
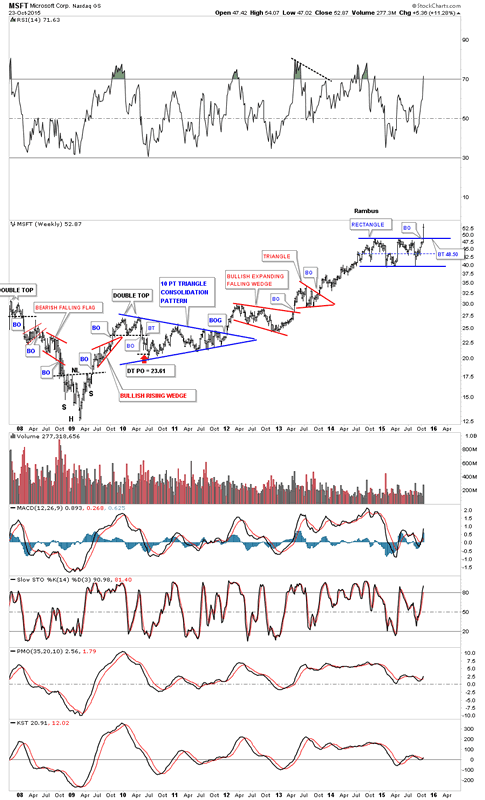
This weekly chart for MSFT shows all the consolidation patterns that have formed since its 2009 crash low including the breakout of the blue rectangle consolidation pattern last week.
I have many more charts to show you in regards to the massive consolidation patterns that have shown up on a lot of the old glory day tech stocks. Is history going to repeat again? Stay tuned. All the best...Rambus
Microsoft Weekly Chart
Gary (for Rambus Chartology)
FREE TRIAL - http://rambus1.com/?page_id=10
© 2015 Copyright Rambus- All Rights Reserved
Disclaimer: The above is a matter of opinion provided for general information purposes only and is not intended as investment advice. Information and analysis above are derived from sources and utilising methods believed to be reliable, but we cannot accept responsibility for any losses you may incur as a result of this analysis. Individuals should consult with their personal financial advisors.
© 2005-2022 http://www.MarketOracle.co.uk - The Market Oracle is a FREE Daily Financial Markets Analysis & Forecasting online publication.


