Most Popular
1. It’s a New Macro, the Gold Market Knows It, But Dead Men Walking Do Not (yet)- Gary_Tanashian
2.Stock Market Presidential Election Cycle Seasonal Trend Analysis - Nadeem_Walayat
3. Bitcoin S&P Pattern - Nadeem_Walayat
4.Nvidia Blow Off Top - Flying High like the Phoenix too Close to the Sun - Nadeem_Walayat
4.U.S. financial market’s “Weimar phase” impact to your fiat and digital assets - Raymond_Matison
5. How to Profit from the Global Warming ClImate Change Mega Death Trend - Part1 - Nadeem_Walayat
7.Bitcoin Gravy Train Trend Forecast 2024 - - Nadeem_Walayat
8.The Bond Trade and Interest Rates - Nadeem_Walayat
9.It’s Easy to Scream Stocks Bubble! - Stephen_McBride
10.Fed’s Next Intertest Rate Move might not align with popular consensus - Richard_Mills
Last 7 days
Friday Stock Market CRASH Following Israel Attack on Iranian Nuclear Facilities - 19th Apr 24
All Measures to Combat Global Warming Are Smoke and Mirrors! - 18th Apr 24
Cisco Then vs. Nvidia Now - 18th Apr 24
Is the Biden Administration Trying To Destroy the Dollar? - 18th Apr 24
S&P Stock Market Trend Forecast to Dec 2024 - 16th Apr 24
No Deposit Bonuses: Boost Your Finances - 16th Apr 24
Global Warming ClImate Change Mega Death Trend - 8th Apr 24
Gold Is Rallying Again, But Silver Could Get REALLY Interesting - 8th Apr 24
Media Elite Belittle Inflation Struggles of Ordinary Americans - 8th Apr 24
Profit from the Roaring AI 2020's Tech Stocks Economic Boom - 8th Apr 24
Stock Market Election Year Five Nights at Freddy's - 7th Apr 24
It’s a New Macro, the Gold Market Knows It, But Dead Men Walking Do Not (yet)- 7th Apr 24
AI Revolution and NVDA: Why Tough Going May Be Ahead - 7th Apr 24
Hidden cost of US homeownership just saw its biggest spike in 5 years - 7th Apr 24
What Happens To Gold Price If The Fed Doesn’t Cut Rates? - 7th Apr 24
The Fed is becoming increasingly divided on interest rates - 7th Apr 24
The Evils of Paper Money Have no End - 7th Apr 24
Stock Market Presidential Election Cycle Seasonal Trend Analysis - 3rd Apr 24
Stock Market Presidential Election Cycle Seasonal Trend - 2nd Apr 24
Dow Stock Market Annual Percent Change Analysis 2024 - 2nd Apr 24
Bitcoin S&P Pattern - 31st Mar 24
S&P Stock Market Correlating Seasonal Swings - 31st Mar 24
S&P SEASONAL ANALYSIS - 31st Mar 24
Here's a Dirty Little Secret: Federal Reserve Monetary Policy Is Still Loose - 31st Mar 24
Tandem Chairman Paul Pester on Fintech, AI, and the Future of Banking in the UK - 31st Mar 24
Stock Market Volatility (VIX) - 25th Mar 24
Stock Market Investor Sentiment - 25th Mar 24
The Federal Reserve Didn't Do Anything But It Had Plenty to Say - 25th Mar 24

Market Oracle FREE Newsletter

How to Protect your Wealth by Investing in AI Tech Stocks

Top 3 Technical Tools Part 3: MACD - Video Lesson

InvestorEducation / Technical Analysis Oct 13, 2015 - 05:52 AM GMT

By: EWI

InvestorEducation

Enhance your trading confidence with this short lesson on how to combine Moving Average Convergence Divergence with other technical tools.

"Guessing or going by gut instinct won't work over the long run. If you don't have a defined trading methodology, then you don't have a way to know what constitutes a buy or sell signal. Moreover, you can't even consistently correctly identify the trend." -Jeffrey Kennedy


Jeffrey Kennedy is an accomplished teacher and a Senior Analyst here at EWI. Yet he often says that the Wave Principle alone is not a trading methodology. It does not tell you how much trading capital you can afford to risk, or specific guidance about which entry or exit levels are best suited for your trading style or where to set your protective stop.

Kennedy also says that along with risk management and emotional discipline, the right technical tools are a vitally important part of supporting your wave count.

To enhance trading confidence, Jeffrey's 3 favorite technical tools are Japanese candlesticks, RSI, and MACD. (read Part 1 on Japanese Candlesticks and Part 2 on RSI ). Today's lesson shows you how MACD can help identify trading opportunities with an example from USDCAD.

This 2-minute video and overview of MACD are adapted from Jeffrey's Trader's Classroom educational service (which empowers subscribers with information on nearly every aspect of trading).

More from Jeffrey:

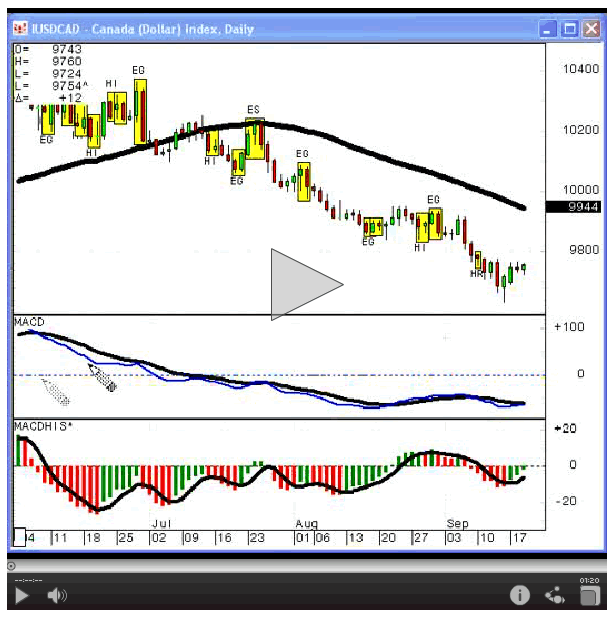
Moving average convergence divergence (MACD) is a momentum indicator developed by Gerald Appel. It consists of two exponential moving averages, the MACD line and Signal line. The difference between these two lines yields an additional indicator, MACD Histogram.

Since these studies evaluate momentum, they work optimally in trending markets. When combined with reversal candlestick patterns, MACD and MACD Histogram can increase confidence in these patterns as well as continuation of the larger trend.

MACD divergence occurs when prices move one way and MACD moves the other. Bearish divergence forms when prices make new highs and MACD does not. Conversely, new price lows without lower MACD readings is bullish divergence. These conditions aid traders in identifying potential changes in momentum and trend.

MACD is constructed using two lines referred to as the MACD line and the Signal line.

When the MACD line appears to penetrate the Signal line, but fails to do so, a hook forms. The significance of a hook is that it coincides with countertrend price moves.

MACD is excellent technical tool provided you know how to use it and what to look for.


Trading Education Week

Get more trading lessons from EWI's Jeffrey Kennedy:

Announcing Trader Education Week

Join us for a FREE trading event that will teach you how to spot trading opportunities in your charts. Spend this week getting free trading lessons that you can apply to your trading immediately -- from one of the world's foremost market technicians, Jeffrey Kennedy.

Whether you are new to trading or have years of experience, you'll benefit from Jeffrey's easy-to-understand style and clear presentation. He'll cover topics such as:

  • Patterns that lead to high-confidence trade setups
  • Momentum indicators to support your pattern analysis
  • Japanese candlestick patterns that alert you to a change of trend
  • How to manage your trades using protective stops
Register now for your FREE week of trading lessons
r.asp?acn=7mo&rcn=aa562&dy=aa0101215&url=http://www.elliottwave.com/club/trader-education-week/default.aspx?articleid=3977">

This article was syndicated by Elliott Wave International and was originally published under the headline (Video Lesson) Top 3 Technical Tools Part 3: MACD. EWI is the world's largest market forecasting firm. Its staff of full-time analysts led by Chartered Market Technician Robert Prechter provides 24-hour-a-day market analysis to institutional and private investors around the world.

About the Publisher, Elliott Wave International
Founded in 1979 by Robert R. Prechter Jr., Elliott Wave International (EWI) is the world's largest market forecasting firm. Its staff of full-time analysts provides 24-hour-a-day market analysis to institutional and private investors around the world.


© 2005-2022 http://www.MarketOracle.co.uk - The Market Oracle is a FREE Daily Financial Markets Analysis & Forecasting online publication.


Post Comment

Only logged in users are allowed to post comments. Register/ Log in