


US Stocks: The [Trend]Line Between Bull and Bear Market
Stock-Markets / Stock Markets 2015 Oct 08, 2015 - 02:50 PM GMTBy: EWI

 Our FREE report shows you just how invaluable trendlines are for anticipating major reversals
Last weekend, I went on a road trip with a friend and her two young sons. The second we left the driveway, the older boy placed a rubber pool noodle in between him and his brother and established the most important ground rule of all sibling driving trips:
"Don't cross this line or else."
Impressively, an entire hour passed without incident when my friend spied the younger son teasingly edging his elbow toward the very outskirts of the noodle, baiting his luck.
Anticipating the ensuing reversal of our event-free driving experience, my friend pre-emptively pulled over to the side of the road, when in -- 3-2-1! -- a small arm crossed the line and a giant tantrum ensued.
Then, it hit me: That rubber pool noodle was to my friend what trendlines are to investors and traders. To wit: If prices edge toward these clearly drawn "lines in the sand" on a market's price chart, then you can "pull over" in advance of major reversals.
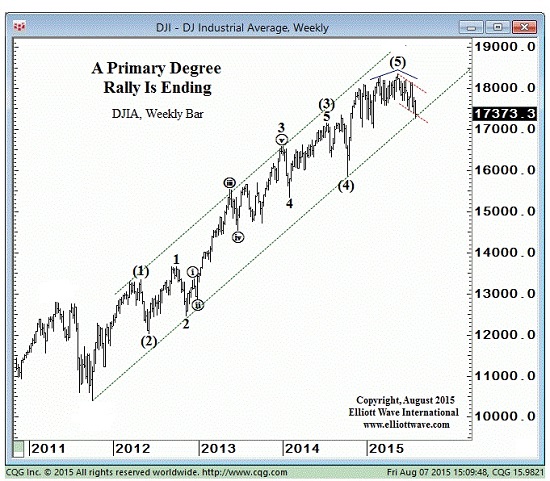
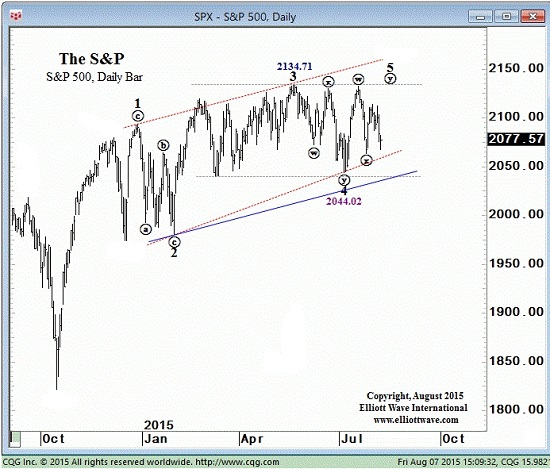
Let's assess a real-world example of the turn-anticipating utility of trendlines. Here, we come to Elliott Wave International's August 10 Short Term Update, where clearly defined trendlines were drawn on the near-term price charts of both the Dow Jones Industrial Average and S&P 500. The implications of prices nearing these trendlines was mutually bearish, as Short Term Update makes clear (partial Elliott Wave labels shown):
"This weekly Dow chart shows the index declining this week to the bottom line of a parallel channel formed by the rally from the October 2011 low. This week marks the third touchpoint since 2011. A meaningful close below this trendline will be another piece of evidence supporting the bearish case."
"The next step in the topping process is for the S&P 500 to confirm the Dow's decline... The blue trendline on the chart is parallel to the red line connecting the highs of waves 1 and 3 and represents point where the diagonal is confirmed as complete. Our view is that a decline below 2044.02 should be enough to indicate that a top is in place, but we mention the lower line in order to be conservative in our judgment that a major bear market is starting."
Unless you were on a deserted island, you know what happened just one week later: On August 20, the U.S. stock market embarked on its most volatile period since the 2008 financial crisis, marked by:
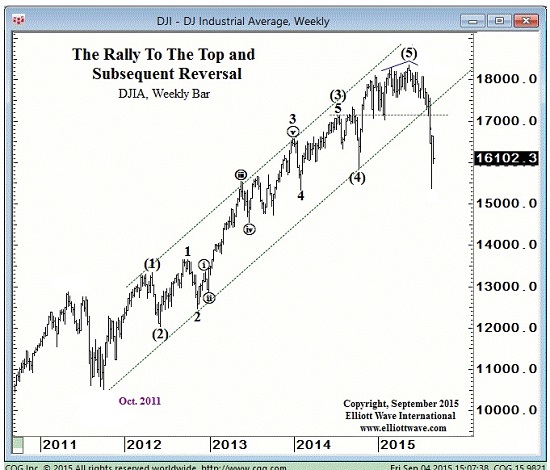
- In August, the DJIA plummeted more than 1100 points, its biggest monthly drop since 2011
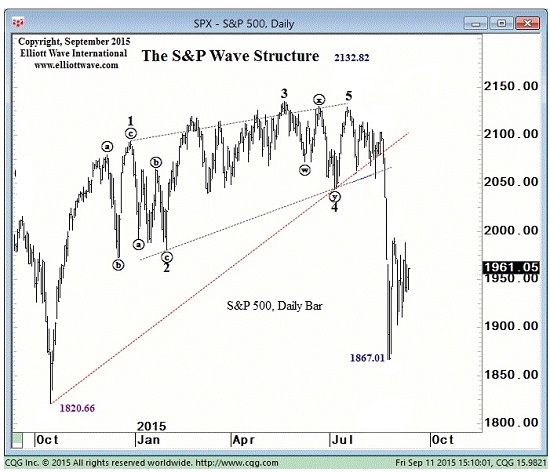
- The S&P 500 also plunged, with 497 out of 500 stocks falling -- only the second time in the market's history that nearly every share fell as one
These charts highlight how, once prices broke through their respective trendlines, the declining wheels were in motion:
So, now that you've seen the value of trendlines first-hand, the next step is adding them to your technical analysis toolbox. And, we have just the solution: EWI's back-by-popular demand free resource titled,
"Trading the Line -- 5 Ways You can Use Trendlines to Improve Your Trading Decisions."
In this must-have14-page report, EWI's chief commodity analyst Jeffrey Kennedy teaches you what trendlines are, and how to identify them on the very price charts you follow. In Jeffrey's own words:
"Trendlines are probably the most basic analytical tool you can apply, whether it's a stock, currency or commodity; yet, they're extremely effective. More often than not, two parallel trendlines contain countertrend or corrective price action. Usually, it provides support, and you see prices either reverse near the lower boundary line or center line... When prices break below this line, the previous move is done."
The best part is, the entire report is absolutely FREE to all Club EWI members!
|
Free 14-Page eBook -- Yours Instantly FREE 14-page eBook: "Trading the Line 5 Ways You Can Use Trendlines to Improve Your Trading Decisions." EWIs Senior Analyst Jeffrey Kennedy shows you how to apply trendline techniques to the markets you follow. Download your free eBook now >> Need a login? Complete your free Club EWI profile to get instant access to this eBook. |
This article was syndicated by Elliott Wave International and was originally published under the headline US Stocks: The [Trend]Line Between Bull and Bear. EWI is the world's largest market forecasting firm. Its staff of full-time analysts led by Chartered Market Technician Robert Prechter provides 24-hour-a-day market analysis to institutional and private investors around the world.
About the Publisher, Elliott Wave International
Founded in 1979 by Robert R. Prechter Jr., Elliott Wave International (EWI) is the world's largest market forecasting firm. Its staff of full-time analysts provides 24-hour-a-day market analysis to institutional and private investors around the world.
© 2005-2022 http://www.MarketOracle.co.uk - The Market Oracle is a FREE Daily Financial Markets Analysis & Forecasting online publication.