Stock Market Bubbles: What the Media Misunderstands
Stock-Markets / Stock Markets 2015 Aug 11, 2015 - 09:19 AM GMTBy: ...
MoneyMorning.com  D.R. Barton, Jr writes: Since the last bona fide financial bubble, the real estate and credit bubble of 2007 to 2009, it seems like every time anyone pays a few pennies too much for a stock, there is a flock of analysts ready to start crowing "bubble!" like so many birds on a wire.
I believe that any pundit who calls a sector or market a "bubble" when they really mean "fundamentally or technically overbought" should be banished from pontificating until the real bubble appears.
That's no hollow gripe: These talking heads can do serious damage with their flawed analyses. Regular investors who heed their bad advice can end up prematurely exiting what are in fact strong, lucrative positions, leaving billions in upside on the table.
Besides, when you have the facts on your side, like we do, you can easily see that the markets are nowhere near bubble territory.
And the charts I have to show you prove it…
These Facts Tell Me to Stay Invested
I recently appeared on Neil Cavuto's show on FOX Business to argue that "bubble" is one of the most overused words in the financial media, and I also debunked the tech bubble myth.
But now we can dig a little deeper and look at three clear, easy-to-understand metrics that tell us that current tech companies may be overvalued, but are not showing the signs of excess – the very definition of a bubble.
Big tech is earning the big numbers: Practically everyone agrees that big tech is actually earning its valuations.
Apple Inc. (Nasdaq: AAPL) is certainly not overvalued; its recent drop took it down to a trailing 12-month price/earnings ratio (P/E) of 13.3. Google Inc. (Nasdaq: GOOG) has also been putting up huge earnings numbers. Even though, at 29.7, its P/E ratio is higher than Apple's, they are very different businesses (especially in terms of capital intensity, working capital, etc.), and Google remains a cash flow monster. So it's really difficult to make a case that big-cap tech is anything more than an overvalued sector.
Venture capital (VC) sees some high valuations, but no bubble: VC firms are no strangers to "overinvesting at the top," as they did in 1999 and 2000, but most experts see firms as much more savvy in managing the numbers during this more recent bull market. According to deal analytics firm Mattermark:
"Traditional venture capital deals are holding steady for traditional Series A through D, with a small set of outliers successfully negotiating for more favorable ownership or outsized rounds in the last quarter. Some VCs are simply sitting out on deals they expect will be over-priced."
Series A through D are progressive pre-IPO funding rounds for startup companies from earliest (A) to latest (D). So some of the smartest teams in the business are showing restraint, which doesn't point to bubble valuations from a VC perspective.
IPOs are of higher quality – and the rate of offerings is slowing: One of the key benchmarks for classic irrational stock market exuberance (with apologies to former Fed Chair Alan Greenspan) is the number of companies coming to the equities markets in search of funding. During highest market valuations, more and more companies seek the "easy, eager money" that becomes available.
Here we see the most compelling case against those calling the current situation a tech bubble. Let's look at both the quantity and quality of tech IPOs that have come to market in 2015.
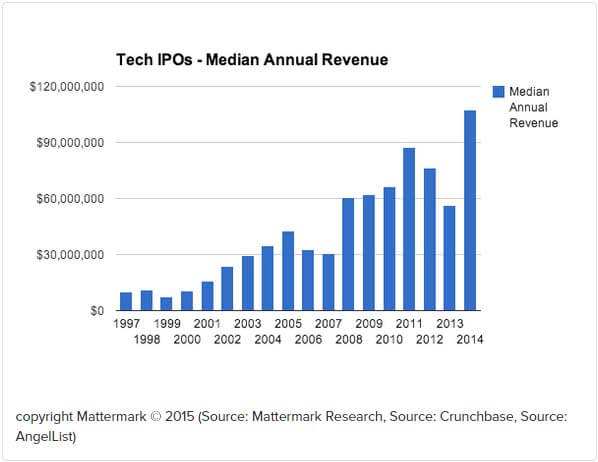
One of the most interesting phenomena that we see in the IPO market is a definite trend toward stronger and more established companies coming to market. We can see this visually in two very useful graphics. The first shows the median annual revenue for tech IPOs:

This clearly shows that fewer "concept companies," that is to say, those firms with a big idea but low or no revenue, are hitting the IPO market.
Here's What a Real Bubble Actually Looks Like
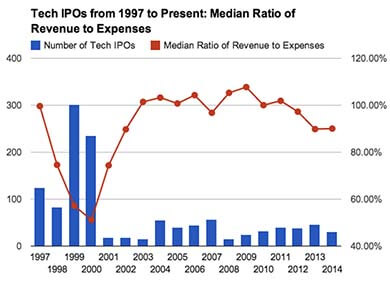
Even more informative is the next chart from Danielle Morrill at Mattermark. It was made in 2014, and I've got updated numbers to show you, too.
Now, this chart helps us see what a real tech bubble looks like – extreme quantities of IPOs and very low company quality coming to the IPO market as seen by very low revenue-to-expense ratios:

Look at those numbers for 1999 and 2000 – now that's a tech bubble! Since this chart was made, let's look at the number of IPOs for all of 2014 and 2015 year to date.
To quantify the smallish blue bars for the most recent years in the charts above, I'll give the numbers going back to 2012 and update 2014 and 2015 (which, again, is not on the chart):
- 2012 had 38 tech IPOs
- 2013 had 45 tech IPOs
- 2014 had 55 tech IPOs
- 2015 has only had 15 tech IPOs so far
So based on the 2015 numbers so far, we're on pace for only 26 tech IPOs this year, less than half of the number we had in 2014. Does that strike you as a bubble-like activity?
There is one area, however, where the market is getting more and more overvalued. And this is where investors can watch for signs of a real stock market bubble…
These "Unicorns" Could Live Up to Mythical Valuations
Thanks to the post-2000 securities regulation changes, companies have been taking longer to come to the IPO market, remaining private for longer. This practice has become so prevalent that in November of 2013, Aileen Lee, founder of Cowboy Ventures, coined the term "unicorn" for a private company that had capital round valuing it at $1 billion or greater.
Here is where we see a huge growth in companies reaching this elite status – and the perceived valuation levels. And it is here where things are really getting overvalued.
There are currently 127 companies worldwide that have valuations over $1 billion, according to the CBInsights' venture capital database. And among those, there are 13 companies that have reached "decacorn" status, meaning they sport valuations of $10 billion or greater.
This private funding is getting, by many estimations, pretty frothy. However, there is much less transparency in the world of private funding, so the bubble debate about companies in this realm will rage on.
Why even talk about these private companies if the average investor can't access them? Quite simply, this private equity market is growing to be an even more significant part of the capital-raising machinery in the global markets than in the past.
Private financing is even becoming a bellwether for the capital markets as companies lengthen their timelines for obtaining IPOs. So while you keep your attention on your stock investments and trades, the private equity market is certainly worth an occasional glance, as it could become a leading indicator for the public markets.
More from D.R.: Why You'll Learn to Love Volatility
When the markets bounce up and down, stocks send very distinct signals virtually invisible to the average investor. If you read them the right way, you could be pocketing cash gains in as little as two days. That's why it's vital you meet the newest member of the Money Map Press team. He's perfected his method for identifying where stocks are headed in volatile markets – and how you can make money in both directions. It's the smartest (and fastest) way to make money we've ever seen, when stocks like Tesla, Amazon, and Apple are getting snapped around. Click here to see how you can cash in…
Source :http://moneymorning.com/2015/08/10/what-the-media-doesnt-get-about-stock-market-bubbles/
Money Morning/The Money Map Report
©2015 Monument Street Publishing. All Rights Reserved. Protected by copyright laws of the United States and international treaties. Any reproduction, copying, or redistribution (electronic or otherwise, including on the world wide web), of content from this website, in whole or in part, is strictly prohibited without the express written permission of Monument Street Publishing. 105 West Monument Street, Baltimore MD 21201, Email: customerservice@moneymorning.com
Disclaimer: Nothing published by Money Morning should be considered personalized investment advice. Although our employees may answer your general customer service questions, they are not licensed under securities laws to address your particular investment situation. No communication by our employees to you should be deemed as personalized investent advice. We expressly forbid our writers from having a financial interest in any security recommended to our readers. All of our employees and agents must wait 24 hours after on-line publication, or after the mailing of printed-only publication prior to following an initial recommendation. Any investments recommended by Money Morning should be made only after consulting with your investment advisor and only after reviewing the prospectus or financial statements of the company.
© 2005-2022 http://www.MarketOracle.co.uk - The Market Oracle is a FREE Daily Financial Markets Analysis & Forecasting online publication.


