Most Popular
1. It’s a New Macro, the Gold Market Knows It, But Dead Men Walking Do Not (yet)- Gary_Tanashian
2.Stock Market Presidential Election Cycle Seasonal Trend Analysis - Nadeem_Walayat
3. Bitcoin S&P Pattern - Nadeem_Walayat
4.Nvidia Blow Off Top - Flying High like the Phoenix too Close to the Sun - Nadeem_Walayat
4.U.S. financial market’s “Weimar phase” impact to your fiat and digital assets - Raymond_Matison
5. How to Profit from the Global Warming ClImate Change Mega Death Trend - Part1 - Nadeem_Walayat
7.Bitcoin Gravy Train Trend Forecast 2024 - - Nadeem_Walayat
8.The Bond Trade and Interest Rates - Nadeem_Walayat
9.It’s Easy to Scream Stocks Bubble! - Stephen_McBride
10.Fed’s Next Intertest Rate Move might not align with popular consensus - Richard_Mills
Last 7 days
All Measures to Combat Global Warming Are Smoke and Mirrors! - 18th Apr 24
Cisco Then vs. Nvidia Now - 18th Apr 24
Is the Biden Administration Trying To Destroy the Dollar? - 18th Apr 24
S&P Stock Market Trend Forecast to Dec 2024 - 16th Apr 24
No Deposit Bonuses: Boost Your Finances - 16th Apr 24
Global Warming ClImate Change Mega Death Trend - 8th Apr 24
Gold Is Rallying Again, But Silver Could Get REALLY Interesting - 8th Apr 24
Media Elite Belittle Inflation Struggles of Ordinary Americans - 8th Apr 24
Profit from the Roaring AI 2020's Tech Stocks Economic Boom - 8th Apr 24
Stock Market Election Year Five Nights at Freddy's - 7th Apr 24
It’s a New Macro, the Gold Market Knows It, But Dead Men Walking Do Not (yet)- 7th Apr 24
AI Revolution and NVDA: Why Tough Going May Be Ahead - 7th Apr 24
Hidden cost of US homeownership just saw its biggest spike in 5 years - 7th Apr 24
What Happens To Gold Price If The Fed Doesn’t Cut Rates? - 7th Apr 24
The Fed is becoming increasingly divided on interest rates - 7th Apr 24
The Evils of Paper Money Have no End - 7th Apr 24
Stock Market Presidential Election Cycle Seasonal Trend Analysis - 3rd Apr 24
Stock Market Presidential Election Cycle Seasonal Trend - 2nd Apr 24
Dow Stock Market Annual Percent Change Analysis 2024 - 2nd Apr 24
Bitcoin S&P Pattern - 31st Mar 24
S&P Stock Market Correlating Seasonal Swings - 31st Mar 24
S&P SEASONAL ANALYSIS - 31st Mar 24
Here's a Dirty Little Secret: Federal Reserve Monetary Policy Is Still Loose - 31st Mar 24
Tandem Chairman Paul Pester on Fintech, AI, and the Future of Banking in the UK - 31st Mar 24
Stock Market Volatility (VIX) - 25th Mar 24
Stock Market Investor Sentiment - 25th Mar 24
The Federal Reserve Didn't Do Anything But It Had Plenty to Say - 25th Mar 24

Market Oracle FREE Newsletter

How to Protect your Wealth by Investing in AI Tech Stocks

Strong Bearish Signal Given Today on the Tadawul (Saudi Stock Exchange)!

Stock-Markets / Saudi Arabia Aug 03, 2015 - 10:07 AM GMT

By: Submissions

Stock-Markets

Bruce Powers writes: A bearish head and shoulders top formation (HS) was triggered today on the Tadawul All Share Index (TASI), with the index falling 3.20 per cent to end the day at 8,807.24. The bearishtrigger was on a move below the neckline at 9,057. Momentum picked up on the way down with the index closing in the bottom quarter of the day’s range. 


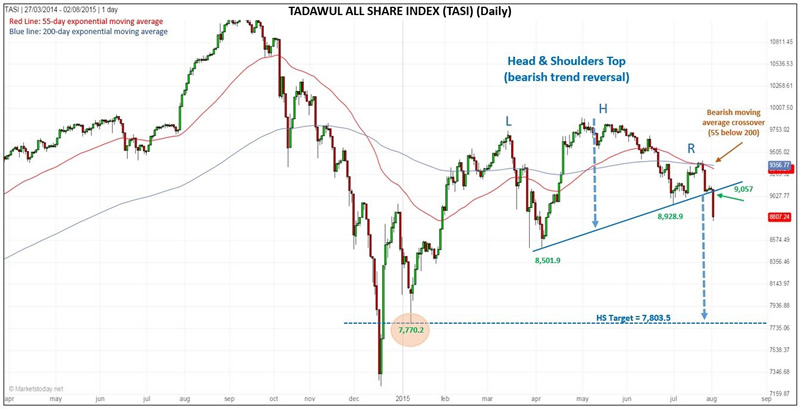
An additional bearish signal was given on today’s drop below previous support at 8,928.27, triggering a continuation of the short-term down trend. Last week, the shorter 55-day exponential moving average (ema) crossed below the longer 200-day ema, providing an early warning that selling pressure could intensify. The 55-day spent the past two months above the 200-day ema (bullish) after staying below it since mid-December 2014.

The target from the HS pattern is approximately 7,803.50, right in the area of support at 7,770.2 seen during a spike low on January 6th of this year. Together, this creates an eventual high probability target zone from around 7,803 to 7,770. 

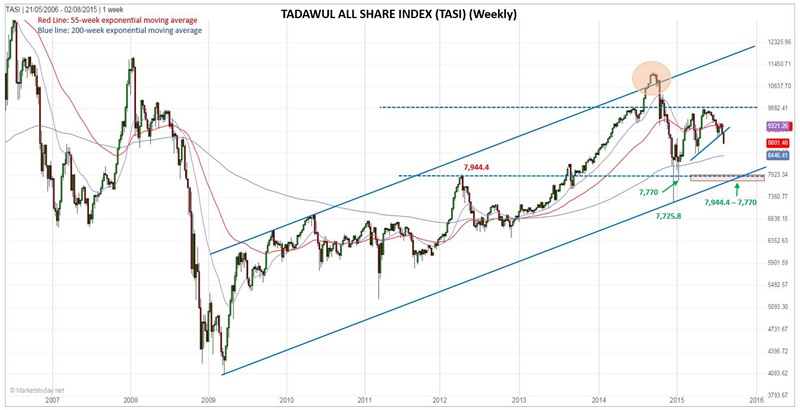
This target zone can be expanded slightly when taking into account the larger view as seen in the enclosed weekly chart. We can add in previous resistance (now potential support) from the swing high in 2012, which was at 7,944.4. In addition, the long-term uptrend channel line converges with the above price areas, giving further support to the chance that a decline will be held at or above the 7,944 to 7,770 price zone.

By Bruce Powers, CMT

About MarketsToday.net: MarketsToday.net® is an online financial portal covering the Middle East stock markets, plus spot Forex, oil, and precious metals, published in both Arabic and English. It is designed to help keep investors and traders up-to-date with the latest news, quotes, performance trends, and market developments in the Middle East stock markets.

Copyright 2015 © MarketsToday - All Rights Reserved

Disclaimer: The above is a matter of opinion provided for general information purposes only and is not intended as investment advice. Information and analysis above are derived from sources and utilising methods believed to be reliable, but we cannot accept responsibility for any losses you may incur as a result of this analysis. Individuals should consult with their personal financial advisors.


© 2005-2022 http://www.MarketOracle.co.uk - The Market Oracle is a FREE Daily Financial Markets Analysis & Forecasting online publication.


Post Comment

Only logged in users are allowed to post comments. Register/ Log in