Gold Investors Opportunity to Potentially Double Their Money
Commodities / Gold and Silver 2015 Jul 20, 2015 - 03:12 PM GMTBy: Ned_W_Schmidt
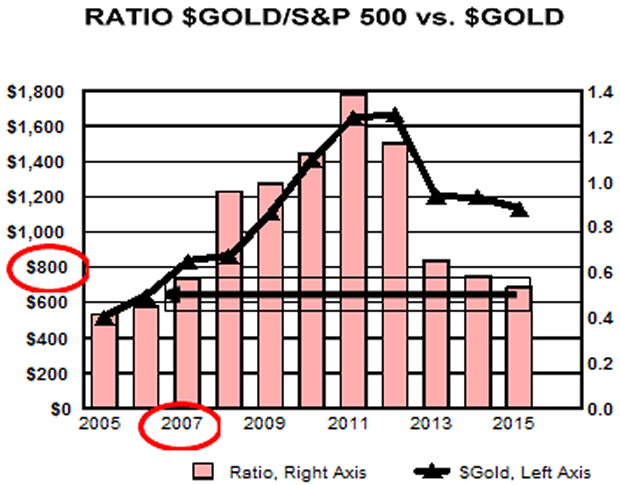
 Rarely does childish selling of the Street and massive forced selling in China give Gold investors an opportunity to potentially double their money. That is what it may be happening at this very time in Gold and Silver markets. Now may be time to sell all exposure to the Lofty Lunacy, those internet / technology / growth / biotechnology fantasy stocks, your first born male child, your home, your dog, and whatever to add Gold and Silver to your portfolio. Last time the Street was as bearish on $Gold was 2007 when the price closed out the year at $830. $Gold went on to more than double.

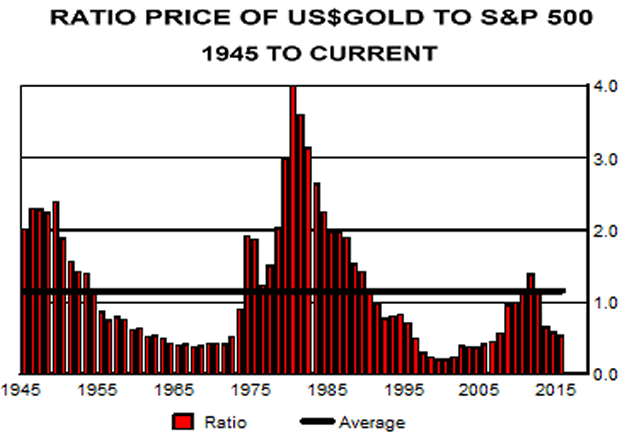
Bars in chart to right are the ratio of year end values for $Gold divided by that for S&P 500, back to 1945. Last bar in chart is for the current value of that ratio. Solid black is line is average of that ratio over the time period shown. High ratio suggests that $Gold is expensive relative to U.S. equities. A low value indicates that $Gold is cheap relative to U.S. equities. This valuation ratio is not a short-term timing tool, but rather can be an indication of when the potential of $Gold to appreciate in the future relative to the S&P 500 is high.
Bottom chart to right portrays the experience of that ratio over just the past decade. Black line in chart is year end value of $Gold, using left axis. Black arrow allows you to follow the latest plot back in time to when it was last at the current level. We have circled 2007 and $800 to make it easy to see how the current situation compares.

2007 is of note for $Gold was roughly $800. From there it went on to double. As we remember it, the media, print and broadcast, was decidedly negative on Gold. Often repeating how misguided were the Gold bugs and how the Federal Reserve had everything under the control.
As we have noted before when reviewing the above graphs, the average ratio can be used to calculate implied valuations for Gold and the S&P 500. As shown in the table below, if the S&P 500 is correctly priced, then $Gold should be trading above $2,400. Alternative is to assume that $Gold is correctly priced. In that case the S&P 500 should be at 979, or 55% below the current value. Caveat that reality should be somewhere in between need be noted.
Data: 1945 - 2015 70 Years
| Current Ratio | 0.523 | Probability Go Higher | 77% |
| Average Ratio | 1.16 | Standard Deviation | 0.86 |
| If S&P 500 = | 2,126 | $Gold should be: | $2,459 +121% |
| If $Gold = | $1,112 | S&P 500 should be: | 962 -55% |
Valuation is not a market timing tool. Valuation of an asset tells us when the price has the potential to rise. That , however, is a lot of information. When an asset's price is identified as under valued an investor is simple waiting for some event to move that price higher. For Gold, the possibilities are numerous. One possibility would be that some unexpected negative world event occurs. Or, other investors could identify the under valuation leading to their buying of the asset.

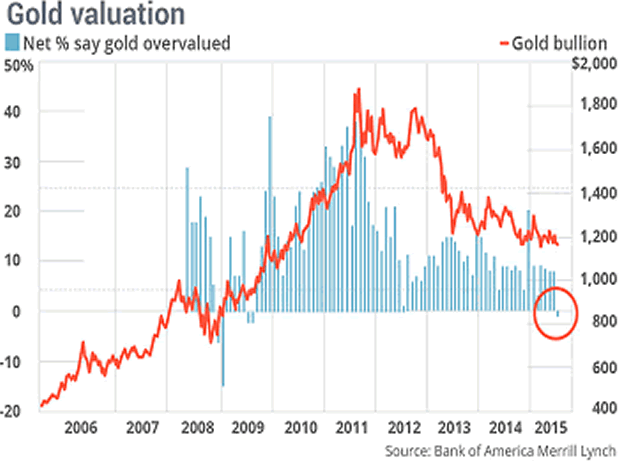
Rare on internet is a media article in which one finds truly meaningful information. Chart to right came from one such rare article by Brett Arends of marketwatch.com, "Top money managers are turning to gold -- should you?" 17 July. Per Brett, Bank of America Merrill Lynch has been surveying large money managers on their opinion of Gold for a number of years.
Plotted with blue bars, using left axis, is the net percentage of those money manager that believe Gold is over valued. Red line is price of $Gold using right axis. If blue bar is positive, more managers believe that $Gold is over valued than believe it is under valued. If blue bar is negative, a majority of money manager believe $Gold is under valued.
As can be observed by in chart, latest survey plot indicates a slight majority now believe Gold is under valued. Last time a majority of money managers in this survey believed $Gold was under value was in 2009. Also observable is that $Gold, red line, advanced nicely in price after that shift in sentiment, in fact to an all time high.
Investors have many choices. One is to listen to perennial Gold bears with charts only interpreted to point down. One could also put their wealth in GOOG as it rockets upward is a speculative frenzy, a certainly questionable action. Or, one can look at some of the facts. $Gold is deeply under valued. Sentiment has shifted to positive for the first time in six years. With $Gold having the potential to double from current prices, why would one not add more Gold to their portfolio?
Ned W. Schmidt,CFA is publisher of The Agri-Food Value View, a monthly exploration of the Agri-Food Super Cycle, and The Value View Gold Report, a monthly analysis of the true alternative currency. To contract Ned or to learn more, use either of these links: www.agrifoodvalueview.com or www.valueviewgoldreport.com
Ned W Schmidt Archive |
© 2005-2022 http://www.MarketOracle.co.uk - The Market Oracle is a FREE Daily Financial Markets Analysis & Forecasting online publication.


