Greece and China: Heralding a New Stocks Bear Market?
Stock-Markets / Stock Markets 2015 Jul 12, 2015 - 01:27 PM GMTBy: Clif_Droke
 What started out as typically sluggish summer week quickly morphed into an extremely eventful one. In just the last five days we witnessed the intensification of the Greek debt roller coaster, the bursting of a mini-bubble in Chinese equities, a temporary shutdown of trading on the NYSE, and a brief but meaningful pullback in U.S. equities. And to think the summer is still young!
Investors are clearly disquieted over the impact the overseas crises might have on the U.S. stock market. But are they right to be concerned?
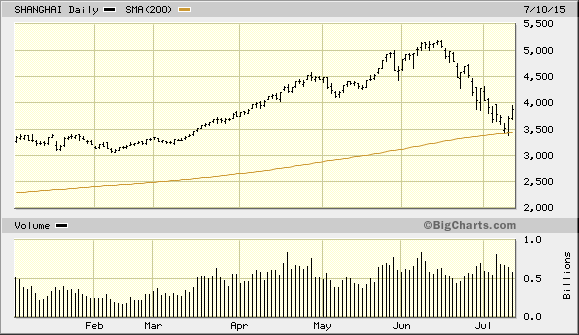
Before we answer that question let's take a closer look at the principles behind the latest round of global market turmoil. Below is a chart showing the Shanghai Composite Index, which shows the primary trend of the Chinese stock market. As we've talked about in the past, China's stock market also can serve as a leading indicator for the S&P. It goes without saying that China's prospects carry an outsized impact on the global economy, including its primary trading partner.
Coming to the rescue of the broad market this past week was the 200-day moving average, first for China's Shanghai Composite Index and then for the S&P 500 Index (SPX). Both indices finished the week above their lows and both made nominal gains for the week. China's stock market caught a much needed break as a powerful short-covering rally kicked off, giving the bulls an opportunity to regroup. It's worth mentioning that while China's Shanghai index has relinquished much of its gains in the past month, it's still up almost 80 percent in the past year. By any historical measure this is extremely impressive.

As for the controversy surrounding Greece, the last few days have demonstrated the ability of negative news headlines to catalyze market moves when stock market internal momentum is declining. Under any other technical condition the headline surprises of the past month would have been shrugged off by the broad market. But with the NYSE internal momentum indicators (based on the new 52-week highs and lows) in steep decline, the path of least resistance for stocks was down.
As long as the daily number of new 52-week lows on the NYSE remains well above 40 the stock market's weakened internal condition will leave it vulnerable to negative headline surprises. Despite this negative short-term variable, however, it's a testament to the overall strength of the U.S. broad market that the major indices haven't taken worse hits despite the bad overseas news lately. I think we can chalk this up to the underrated impact of the Year Five Phenomenon. This is another way of saying that the 10-year equity market cycle is in the ascent as are several of the other major long-term Kress cycles.
With so many long-term cycles in the "up" phase, the bears are having a difficult time creating downside momentum for equity prices. The Year Five Phenomenon should be even more favorable for the bulls beginning around the fourth quarter of 2015. This is why the crises in Greece and China are unlikely to bring the bear out of hibernation for the U.S. anytime soon.
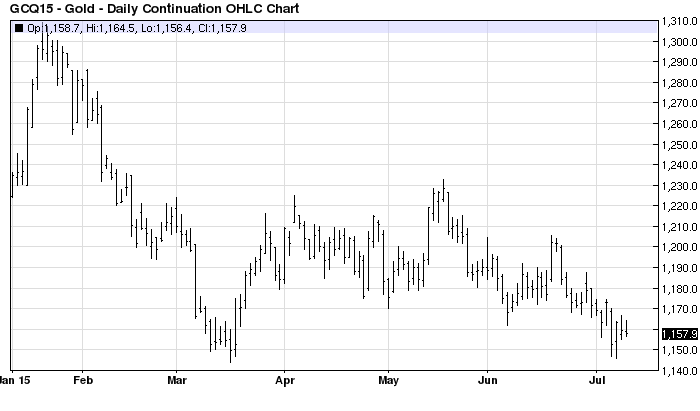
If the Greek debt drama in that country truly poses a serious threat to the global economy, however, it should be evident in the price of gold. Gold as a barometer of investor fear is nonpareil; it responds whenever informed investors foresee situations which threaten global market stability.

Instead of a concerned response among gold investors, what we find is that the yellow metal is singularly unconcerned with the recent goings on overseas. As the ultimate fear gauge, gold's failure to rally in the face of global market turmoil strongly suggests informed investors don't foresee a global recession anytime soon. I maintain that if gold isn't unduly concerned with foreign market turbulence, neither should we be alarmed.
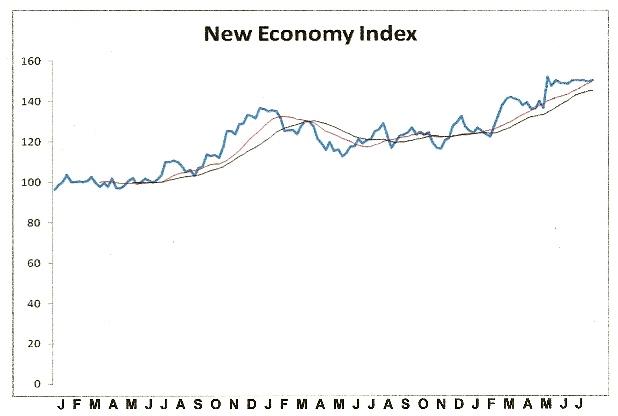
While Greece's economy remains in tatters, China's economy is still quite strong. The popping of the mini-bubble in Chinese equities is nothing if not a growing pain for the world's manufacturing powerhouse. Meanwhile in the U.S., the consumer is slowly beginning to flex his muscles after years of remaining dormant. The state of the retail economy can be quickly gauged by looking at a composite stock price of the leading U.S. consumer retail, business service, and business transportation stocks. This composite picture is encapsulated in the New Economy Index (NEI).
As the following picture shows, the U.S. retail economy is still in good shape, though it's hardly growing by leaps and bounds. The two trend lines in the NEI chart reflect the 12-week (red line) and 20-week (black line) moving averages. As of July 10, NEI has equaled an 8-year high made earlier this year.

If you'll indulge me, I'd like to offer some anecdotal evidence on the state of the economy in my neck of the woods. Living as I do in a tourist-dominated regional economy along the North Carolina coast, I have the unique perspective of being able to observe the yearly changes in tourist spending patterns. The first few years following the tumultuous housing crisis were understandably subdued. Housing construction and real estate sales declined appreciably while the demand for summer housing rentals was also down for the next few years after 2008.
Gradually the real estate and tourism outlook in the coastal Carolinas began improving, though, and by 2013 it was clear that the region's economy had turned a corner. The summer of 2015 has been a stellar summer for the region's tourism and the best one I've observed in some time.
June and July have been record tourism months for many ocean communities along the North Carolina coast. As someone has observed, this summer's increase in shark attacks is a backhanded compliment to the success of the Chambers of Commerce in drawing people to the beach. The pace of new home development has dramatically picked up this year, too, and appears to be accelerating. The region's economy is clearly on the upswing.
I mention this because what bodes well for Carolina coast real estate and tourism typically augurs well for East Coast real estate in the aggregate. Considering that the West Coast has seen most of the improvement in the real estate market in recent years, it looks like the East is about to experience its own resurgence. This in turn will further stimulate an economy in need of an extra boost.
Mastering Moving Averages
The moving average is one of the most versatile of all trading tools and should be a part of every investor's arsenal. Far more than a simple trend line, it's also a dynamic momentum indicator as well as a means of identifying support and resistance across variable time frames. It can also be used in place of an overbought/oversold oscillator when used in relationship to the price of the stock or ETF you're trading in.
In my latest book, Mastering Moving Averages, I remove the mystique behind stock and ETF trading and reveal a simple and reliable system that allows retail traders to profit from both up and down moves in the market. The trading techniques discussed in the book have been carefully calibrated to match today's fast-moving and sometimes volatile market environment. If you're interested in moving average trading techniques, you'll want to read this book.
Order today and receive an autographed copy along with a copy of the book, The Best Strategies for Momentum Traders. Your order also includes a FREE 1-month trial subscription to the Momentum Strategies Report newsletter: http://www.clifdroke.com/books/masteringma.html
By Clif Droke
www.clifdroke.com
Clif Droke is the editor of the daily Gold & Silver Stock Report. Published daily since 2002, the report provides forecasts and analysis of the leading gold, silver, uranium and energy stocks from a short-term technical standpoint. He is also the author of numerous books, including 'How to Read Chart Patterns for Greater Profits.' For more information visit www.clifdroke.com
Clif Droke Archive |
© 2005-2022 http://www.MarketOracle.co.uk - The Market Oracle is a FREE Daily Financial Markets Analysis & Forecasting online publication.


