Most Popular
1. Banking Crisis is Stocks Bull Market Buying Opportunity - Nadeem_Walayat
2.The Crypto Signal for the Precious Metals Market - P_Radomski_CFA
3. One Possible Outcome to a New World Order - Raymond_Matison
4.Nvidia Blow Off Top - Flying High like the Phoenix too Close to the Sun - Nadeem_Walayat
5. Apple AAPL Stock Trend and Earnings Analysis - Nadeem_Walayat
6.AI, Stocks, and Gold Stocks – Connected After All - P_Radomski_CFA
7.Stock Market CHEAT SHEET - - Nadeem_Walayat
8.US Debt Ceiling Crisis Smoke and Mirrors Circus - Nadeem_Walayat
9.Silver Price May Explode - Avi_Gilburt
10.More US Banks Could Collapse -- A Lot More- EWI
Last 7 days
Stock Market Volatility (VIX) - 25th Mar 24
Stock Market Investor Sentiment - 25th Mar 24
The Federal Reserve Didn't Do Anything But It Had Plenty to Say - 25th Mar 24
Stock Market Breadth - 24th Mar 24
Stock Market Margin Debt Indicator - 24th Mar 24
It’s Easy to Scream Stocks Bubble! - 24th Mar 24
Stocks: What to Make of All This Insider Selling- 24th Mar 24
Money Supply Continues To Fall, Economy Worsens – Investors Don’t Care - 24th Mar 24
Get an Edge in the Crypto Market with Order Flow - 24th Mar 24
US Presidential Election Cycle and Recessions - 18th Mar 24
US Recession Already Happened in 2022! - 18th Mar 24
AI can now remember everything you say - 18th Mar 24
Bitcoin Crypto Mania 2024 - MicroStrategy MSTR Blow off Top! - 14th Mar 24
Bitcoin Gravy Train Trend Forecast 2024 - 11th Mar 24
Gold and the Long-Term Inflation Cycle - 11th Mar 24
Fed’s Next Intertest Rate Move might not align with popular consensus - 11th Mar 24
Two Reasons The Fed Manipulates Interest Rates - 11th Mar 24
US Dollar Trend 2024 - 9th Mar 2024
The Bond Trade and Interest Rates - 9th Mar 2024
Investors Don’t Believe the Gold Rally, Still Prefer General Stocks - 9th Mar 2024
Paper Gold Vs. Real Gold: It's Important to Know the Difference - 9th Mar 2024
Stocks: What This "Record Extreme" Indicator May Be Signaling - 9th Mar 2024
My 3 Favorite Trade Setups - Elliott Wave Course - 9th Mar 2024
Bitcoin Crypto Bubble Mania! - 4th Mar 2024
US Interest Rates - When WIll the Fed Pivot - 1st Mar 2024
S&P Stock Market Real Earnings Yield - 29th Feb 2024
US Unemployment is a Fake Statistic - 29th Feb 2024
U.S. financial market’s “Weimar phase” impact to your fiat and digital assets - 29th Feb 2024
What a Breakdown in Silver Mining Stocks! What an Opportunity! - 29th Feb 2024
Why AI will Soon become SA - Synthetic Intelligence - The Machine Learning Megatrend - 29th Feb 2024
Keep Calm and Carry on Buying Quantum AI Tech Stocks - 19th Feb 24

Market Oracle FREE Newsletter

How to Protect your Wealth by Investing in AI Tech Stocks

Brent Crude Oil Price Breaks out of Bearish Wedge

Commodities / Crude Oil Jul 07, 2015 - 01:21 PM GMT

By: MarketsToday

Commodities

Brent Crude broke down from a bearish rising wedge formation several weeks ago, trading relatively sideways thereafter, until the tail end of last week when it fell below and closed below $60.97. The 50% retracement at $57.41 was surpassed yesterday to the downside, with the next target being around the 61.8% Fibonacci retracement level at $54.53, followed by the most recent swing low (C) at $52.61.


There’s only been one leg down since the bearish breakout so rallies up into resistance can be used to get out of long positions or enter new shorts. Resistance could be found around the short-term downtrend line (see Daily chart), followed by around $62.71/62.97, consisting of the 55-day exponential moving average (ema) and a previous peak, respectively. Those price areas then start a potential resistance zone up to approximately 66.33, consisting of a prior consolidation phase.

A rally above $66.33 could change the outlook to bullish, depending on how Brent arrived at that price level.

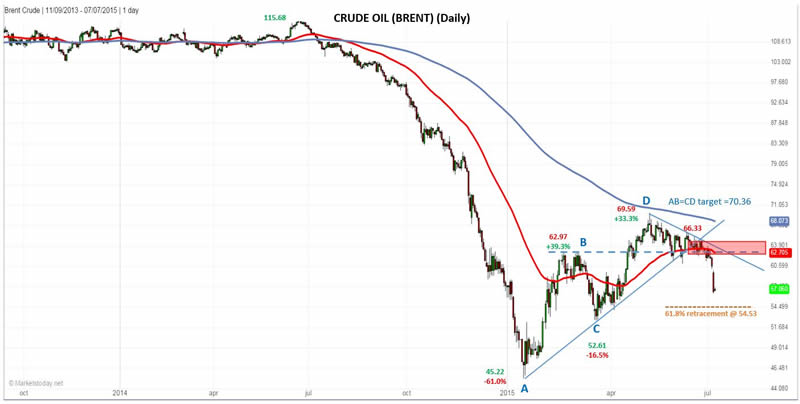
On May 6th, Brent peaked at $69.59, just 1% shy of completing a perfect AB=CD pattern, and just under resistance of the 200-day ema. This combined with the breakout of the bearish wedge points to the possibility that the rally in Brent has come to an end. The wedge breakout is a classic trend continuation pattern and so far it is signaling that the downtrend that started a little over a year ago will continue. Watch the level of strength in the next rally for signs of what’s to come.

Based on the wedge pattern alone, the target from the breakout is the beginning of the pattern at 45.22.

By Bruce Powers, CMT

About MarketsToday.net: MarketsToday.net® is an online financial portal covering the Middle East stock markets, plus spot Forex, oil, and precious metals, published in both Arabic and English. It is designed to help keep investors and traders up-to-date with the latest news, quotes, performance trends, and market developments in the Middle East stock markets.

Copyright 2015 © MarketsToday - All Rights Reserved

Disclaimer: The above is a matter of opinion provided for general information purposes only and is not intended as investment advice. Information and analysis above are derived from sources and utilising methods believed to be reliable, but we cannot accept responsibility for any losses you may incur as a result of this analysis. Individuals should consult with their personal financial advisors.


© 2005-2022 http://www.MarketOracle.co.uk - The Market Oracle is a FREE Daily Financial Markets Analysis & Forecasting online publication.


Post Comment

Only logged in users are allowed to post comments. Register/ Log in