


Happy 4th of July Stock Market Analysis
Stock-Markets / Stock Markets 2015 Jul 04, 2015 - 08:49 PM GMTBy: Tony_Caldaro

 The week started off at SPX 2102, then dropped to 2057 on a gap down Monday. After that the market gapped up three days in a row, but only managed to get back to SPX 2085 by Thursday. Then ended the holiday shortened week at SPX 2077. For the week the SPX/DOW lost 1.20%, the NDX/NAZ lost 1.25%, and the DJ World lost 1.6%. On the economic front positive reports continued to outpace negative ones. On the uptick: pending home sales, the Chicago PMI, consumer confidence, the ADP, ISM manufacturing, construction spending, the WLEI, plus the unemployment rate declined. On the downtick: Case-Shiller, auto sales, factory orders, plus weekly jobless claims rose and payrolls declined. Next week’s reports will be highlighted by the FOMC minutes, ISM services and Consumer credit.
LONG TERM: bull market
For the past eight months the market has remained in a 162 point trading range with the mid-point around SPX 2054. Which was nearly hit on Monday (2056). During this period some market pundits have declared: the market is now extremely overvalued, the EW pattern suggests a bull market top, equities are in a bubble, etc. Our analysis suggests none of these claims can be confirmed. The claims that equities are in a bubble and ‘now’ extremely overvalued does not match basic valuations.
The last time equities were in a bubble was the late 1990’s. Then the PE multiple on the SPX was 37 while the 10YR bond rate was over 6.5%. The earnings yield (1/37) 2.7% was less than half the bond yield. That’s a bubble! Currently the SPX PE is 20, for an earnings yield (1/20) of 5% while the 10YR rate is 2.4%. No bubble here. As for the market is ‘now’ overvalued. We do not see that either. In late 2013, more than 18 months ago, the SPX reached the same PE multiple it has today: 20. During that entire 18 month period the PE multiple has ranged from 18 to 21. The reason the market is now higher is simple because earnings are now higher. There has not been a multiple expansion to suggest an overvaluation.
Lastly, each bull market in EW/OEW terms unfolds in five waves. What creates the five waves are two significant selloffs during the long term trend. These two selloffs are the second and fourth waves of the bull market. Generally they are the two biggest corrections in the bull market. You can go back in history and they are easily identified. During this bull market we have only witnessed one significant correction in 2011: -21.6%. Every correction since then has been less than half that value. And since mid-2012, there has not been one correction of even 10%. Clearly the fourth wave of this bull market has yet to occur. Until it does we can not have a fifth wave to end the bull market. No market top yet.
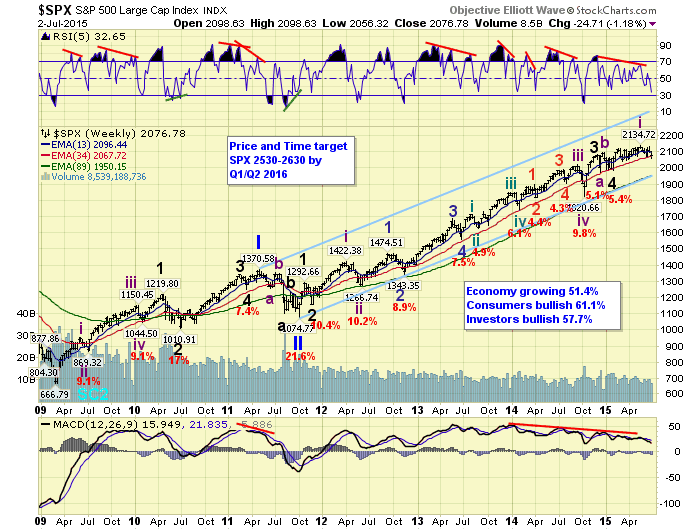
We continue to label this bull market as Cycle wave [1] of the next multi-decade Super cycle bull market. Cycle wave bull markets unfold in five Primary waves. Primary waves I and II completed in 2011, and Primary wave III has been underway since then. When it concludes there will likely be the largest correction since 2011 for Primary IV. Then when it concludes a rising Primary V will end the bull market. We continue to expect a P3 top in the year 2016, followed by a quick P4 correction, then a P5 rise into the year 2017. Targets for Primary III remain on the weekly chart above.
MEDIUM TERM: downtrend
After a new all time high at SPX 2135 in mid-May the market entered a downtrend. We have counted the uptrend from early-February to mid-May as a leading diagonal triangle, and Intermediate wave i of a subdividing Major wave 5. This downtrend is Intermediate wave ii. Major waves 1 and 2 had occurred in late-2011, and Major waves 3 and 4 just ended in late-2014 to early-2015.
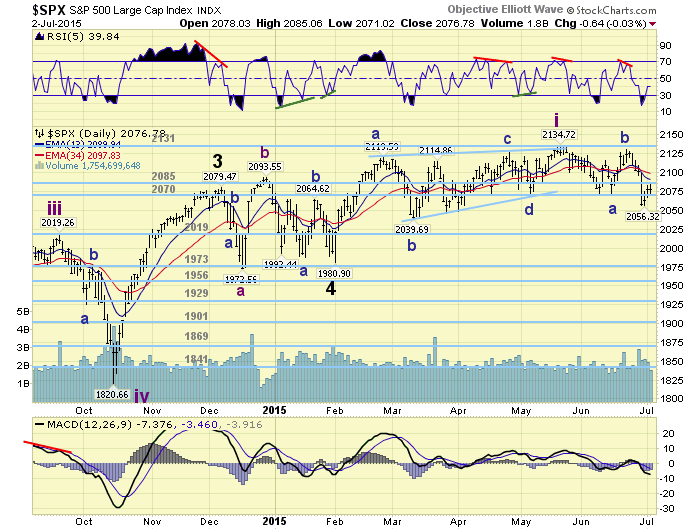
Thus far the downtrend appears to have completed Minor wave A, with a double bottom at SPX 2072; and Minor wave B, with a sharp rally to SPX 2130. Minor wave C is currently underway. When we apply Fibonacci retracement levels to the recent uptrend we arrive with the following SPX levels. At SPX 2076 (38.2%), SPX 2058 (50.0%), and SPX 2040 (61.8%). Notice Minor A stopped just 4 points under the first level. And this week, the ongoing Minor C stopped just two points under the second level. The market is respecting these retracement levels.
We continue to look for downtrend support around the low SPX 2040’s and, worse case, the 2019 pivot range. We would also like to see the NDX/NAZ confirm a downtrend while this is unfolding. They have yet to do so. Medium term support is at the 2070 and 2019 pivots, with resistance at the 2085 and 2131 pivots.
SHORT TERM
The short term pattern has been quite choppy, which is no surprise considering the choppiness of the previous uptrend. After the complex three for Minor A, we had a sharp, almost impulse looking Minor B. Minor C has thus far declined in seven corrective small waves to SPX 2056 on Monday. We labeled that Minute A. Over the next three days Minute B rallied to exactly the 2085 pivot. That was the minimum expected for Minute B, suggesting it can still continue to chop its way higher. When it does conclude Minute wave C should take the market to its downtrend low.
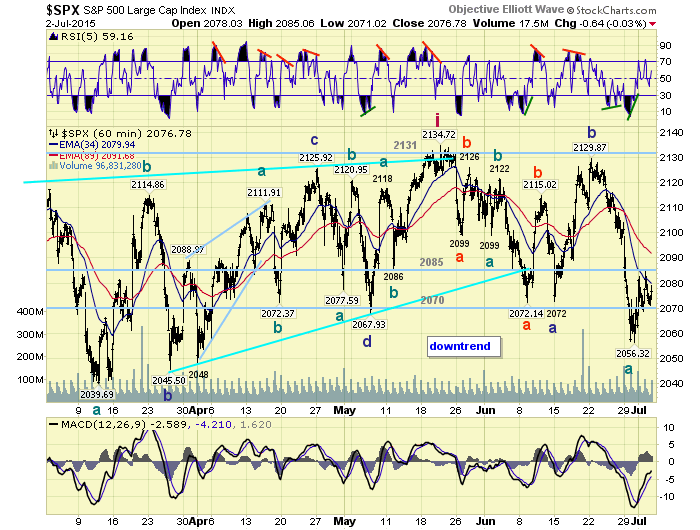
Short term support is at the 2070 pivot and SPX 2056, with resistance at the 2085 and 2131 pivots. Short term momentum ended the week just above neutral. Best to your trading the post-Greek referendum results on Monday.
FOREIGN MARKETS
The Asian markets were mixed on the week for a net loss of 0.7%.
The European markets gave back most of last week’s big gains and lost 3.3%.
The Commodity equity group were all lower for a net loss of 1.1%.
The DJ World index is in a downtrend and lost 1.6%.
COMMODITIES
Bonds remain in a downtrend and lost 0.7% on the week.
Crude is now in a downtrend and lost 5.3% on the week.
Gold remains in a downtrend and lost 0.7% on the week.
The USD confirmed an uptrend and gained 0.7% on the week.
NEXT WEEK
Monday: ISM services at 10am. Tuesday: Trade deficit and Consumer credit. Wednesday: the FOMC minutes. Thursday: weekly Jobless claims, and a speech from FED governor Brainard. Friday: Wholesale inventories and a speech from FED chair Yellen. Best to your weekend and week!
CHARTS: http://stockcharts.com/public/1269446/tenpp
After about 40 years of investing in the markets one learns that the markets are constantly changing, not only in price, but in what drives the markets. In the 1960s, the Nifty Fifty were the leaders of the stock market. In the 1970s, stock selection using Technical Analysis was important, as the market stayed with a trading range for the entire decade. In the 1980s, the market finally broke out of it doldrums, as the DOW broke through 1100 in 1982, and launched the greatest bull market on record.
Sharing is an important aspect of a life. Over 100 people have joined our group, from all walks of life, covering twenty three countries across the globe. It's been the most fun I have ever had in the market. Sharing uncommon knowledge, with investors. In hope of aiding them in finding their financial independence.
Copyright © 2015 Tony Caldaro - All Rights Reserved Disclaimer: The above is a matter of opinion provided for general information purposes only and is not intended as investment advice. Information and analysis above are derived from sources and utilising methods believed to be reliable, but we cannot accept responsibility for any losses you may incur as a result of this analysis. Individuals should consult with their personal financial advisors.
Tony Caldaro Archive |
© 2005-2022 http://www.MarketOracle.co.uk - The Market Oracle is a FREE Daily Financial Markets Analysis & Forecasting online publication.