


Possible Stock Market Panic Coming!
Stock-Markets / Stock Markets 2015 Jun 29, 2015 - 09:20 AM GMTBy: Brad_Gudgeon

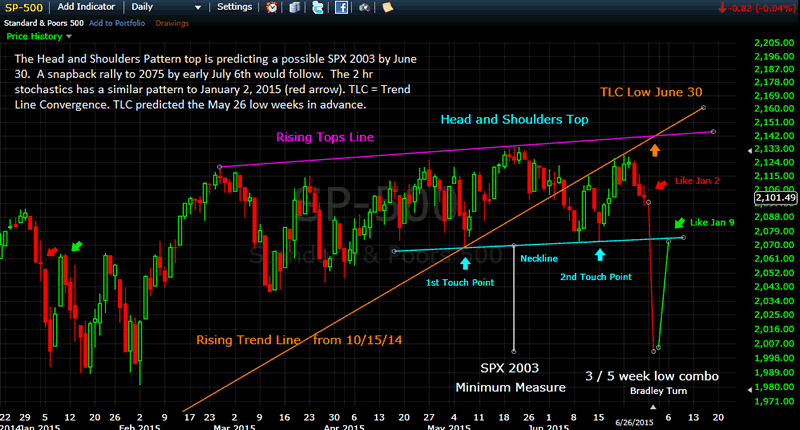
 Last week, I warned of a possible Head and Shoulders Pattern Top looming. Back in the 1980’s, I learned how to do minimum down side measures by measuring the distance from the head to the neckline and then adding it to the neckline. The current minimum measure is for SPX 2003. I also noticed that quite frequently one could also figure the bottom day of the down side move by taking the first touch point of the neckline and counting the trading days to the head (this case it is 10 trading days from 5/6 to 5/20) and then adding that number (10) to the last touch point on the neckline (6/15) + one more trading, which would give us June 30 for the possible low.
I have also noticed that when one takes a rising trend line and a rising tops line and finds the convergence of those two lines, one finds an important bottom. In this case: the October 15, 2014 bottom to the May 6 bottom joined to the Feb 25 to May 20th rising tops line, one arrives at June 30 for an important low. June 30th is also the conjunction of the 5 week low from May 26 and the 3 week low of June 9 making it even more powerful.
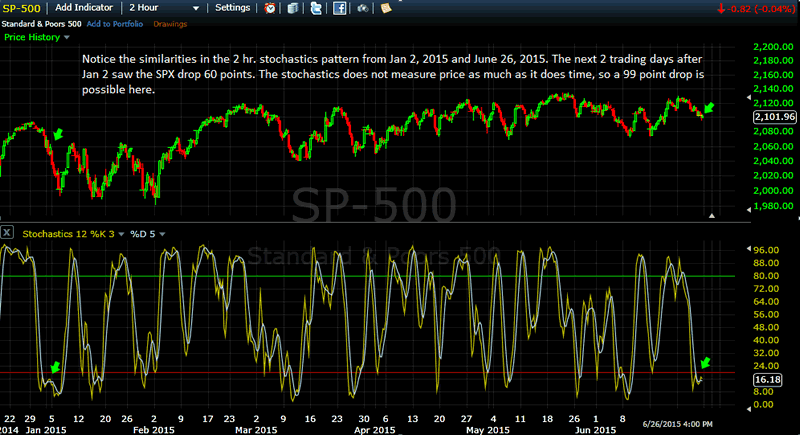
One other thing I noticed was the fact that the 2 hr stochastics on the SPX has a similar pattern to January 2, 2105 right before it dropped 60 points the next 2 days. Also of note, is the rebound that followed (72 points) to what would be in the current time frame: early July 6th. SPX 2003 + 72 points would take the SPX right back to the bottom of the neckline by that date or 2075.
Astro-wise we have Venus trine Uranus on Monday, which likely was noted in the small 4 TD rebound top we had last Friday. Venus conj. Jupiter on June 30/July 1 (WOW! closest conj. of these 2 planets since the time of Jesus’ birth! They will appear as one!), and the Sun trine Neptune on the full moon late July 1 will likely be responsible for the strong rallies of July 1st and 2nd. July 6th to July 25th has the Sun and Mars falling into a cardinal T sq. with Uranus and Pluto. This would equal the same time frame as Jan 9 to Feb 2, 2015.
We have Bradley turns due over the weekend (top?) and again June 30/July 1 (bottom?). We also have a strong Bradley turn due on July 16th, which would point to the same date as January 22, 2015.
I would caution that the above coincidences are compelling, but not set in stone. At a minimum, I have 2080/81 SPX by June 30 or even 2067/68 as possible targets. I have to admit these price targets are not as compelling as the SPX 2003 target, and with the Greek default looming, it would seem plausible that we just might have a global mini panic on our hands come Monday and Tuesday.
The Hurst and Gann Cycles are looking for a conjunction of the 3 and 5 week lows on June 30, which points to even more plausibility of a major event ahead, and the Gann 16 TD top is due on July 6th from the May 20th top.
The two charts below make my case for a possible mini panic:
Silver could gap up early Monday about $0.23, but looks doomed to fall about another $0.80 into around July 6th where it should form an important bottom launching us into the next Mercury Retrograde top due Sept 18th. Silver looks to still be in a bear market and will likely continue into October 2016 where the 8 year commodity cycle bottoms.
So, we shall see what happens over the next 2 days. We are short via SPXS again late Friday after having covered late Thursday near 2101/02 about right where we closed Friday. Whatever happens, I still expect to make money being short the next 2 days. Our BluStar3X auto-trade signals are +33.6% since initialization April 15, 2015.
Brad Gudgeon
Editor of The BluStar Market Timer
The BluStar Market Timer was rated #1 in the world by Timer Trac in 2014, competing with over 1600 market timers. This occurred despite what the author considered a very difficult year for him. Brad Gudgeon, editor and author of the BluStar Market Timer, is a market veteran of over 30 years. The website is www.blustarmarkettimer.info To view the details more clearly, you may visit our free chart look at www.blustarcharts.weebly.com Copyright 2015. All Rights Reserved
Copyright 2015, BluStar Market Timer. All rights reserved.
Disclaimer: The above information is not intended as investment advice. Market timers can and do make mistakes. The above analysis is believed to be reliable, but we cannot be responsible for losses should they occur as a result of using this information. This article is intended for educational purposes only. Past performance is never a guarantee of future performance.
Brad Gudgeon Archive |
© 2005-2022 http://www.MarketOracle.co.uk - The Market Oracle is a FREE Daily Financial Markets Analysis & Forecasting online publication.