


An Inconvenient Truth: The HUI:GOLD Ratio
Commodities / Gold and Silver 2015 Jun 22, 2015 - 08:26 AM GMT

 There are no words to describe the Carnage that Precious Metals Stocks have suffered for the 12 years. There is no consoling those who have invested in this sector, many who have literally lost their life's savings as they watch this horror unfold in utter disbelief.
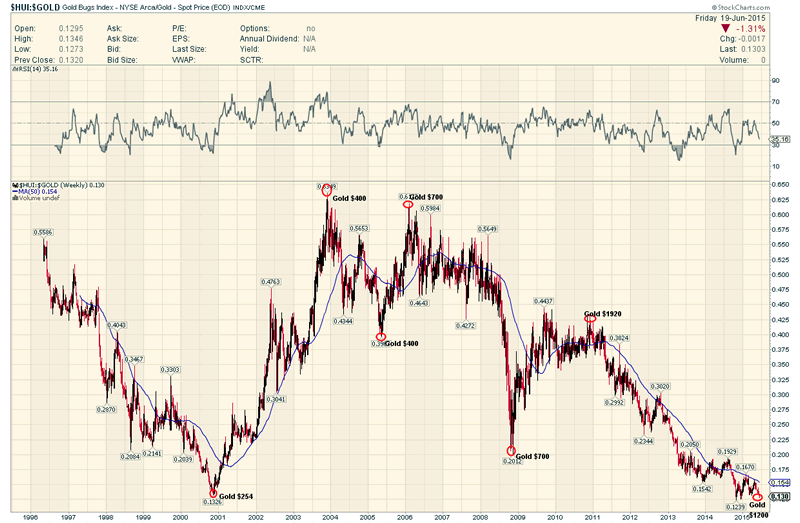
The best way to gauge this complete evisceration of Precious Metals Investors is to follow the HUI:GOLD Ratio.
This ratio compares the most widely followed PM Mining Index . the HUI ...Numerator
with the Price of Gold ...Denominator
This Ratio is widely followed by PM Analysts, many who have been calling for it to bottom since it entered its bear market in...get this...2003 !
Yes 2003!
HUI:Gold Weekly Chart
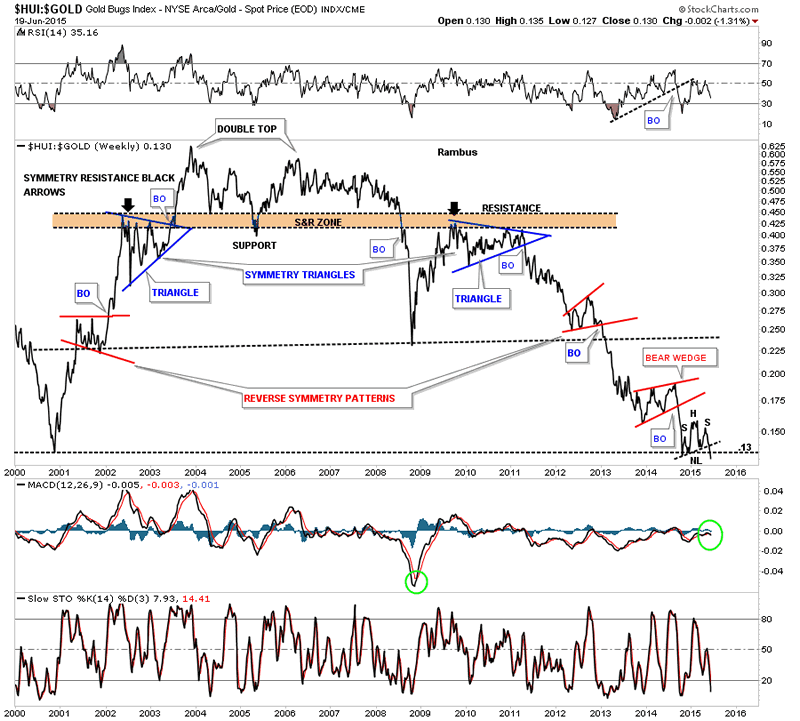
Rambus has documented the fall of this ratio ever since he began this website and has just tonight posted an update showing it has actually broken out of a small consolidation pattern this past week and is now BELOW where it was at the beginning of the Late Great Gold Bull Market in 2001.
Excerpt from Rambus Chartology Weekend Report June 21 2015.
"Next I would like to update you on the long term HUI:GOLD ratio chart we've been following that shows this ratio has finally broken below major long term support, going all the way back to the 2000 low. I have literally waited several years for this ratio chart to break .13 and it finally has. The little H&S consolidation pattern that formed right on the S&R rail has been the key in looking for this ratio to break to new all time lows"
HUI:Gold Weekly Chart 2
Please take a moment to let this stunning chart sink in.
Especially if you have been holding PM Stocks with the view that this ratio cannot possibly go any lower or if you have been bottom fishing in this god forsaken sector.
The price of the Major PM Mining Stocks, as represented by the HUI, is BELOW where they were when gold was trading at $250, 15 years ago.
And in spite of all the analysts saying this was absolutely impossible, this Incredible Ratio is breaking down yet again to new all time lows.
The Mind Boggles.
Fullgoldcrown (For Rambus Chartology)
FREE TRIAL - http://rambus1.com/?page_id=10
© 2015 Copyright Rambus- All Rights Reserved
Disclaimer: The above is a matter of opinion provided for general information purposes only and is not intended as investment advice. Information and analysis above are derived from sources and utilising methods believed to be reliable, but we cannot accept responsibility for any losses you may incur as a result of this analysis. Individuals should consult with their personal financial advisors.
© 2005-2022 http://www.MarketOracle.co.uk - The Market Oracle is a FREE Daily Financial Markets Analysis & Forecasting online publication.