


New Socio-Economic Era Dawning Out of Credit and Fuel Crisis
Commodities / Energy Resources Jun 16, 2008 - 11:17 AM GMTBy: Brian_Bloom

 Several weeks ago this analyst expressed the view that the US Equity markets were in the early stages of a Primary Bear Market and that investors should be more focused on capital preservation than on capital growth.
In hindsight, I continue to hold this view. The core issue seems to be that banks (led by Citigroup), in moving to bring off-balance-sheet items back onto their balance sheets, will likely expose the weaknesses in those balance sheets in the process; and there will likely be a deterioration in their ability/willingness to lend. Additionally, for reasons set out in the body of this article, it seems that the US Fed's ability to create money “out of thin air” is also waning. On balance, it seems that a higher reliance will be placed on equity than on debt in the capital markets. Where will this equity come from? Between them, the BRIC countries and OPEC may have up to $5.8 trillion to invest.
An implication of the above is that the financial power base may be about to shift away from the Anglo-American alliance which has dominated world politics since the early 1900s
Interestingly, the charts are not showing signs of panic. If anything they seem to be evidencing a higher probability of a pullback of key commodities from lofty speculative levels, and a downward drift in the US equity markets.
On the positive side, there are signs that an attitude of profligacy is giving way to an attitude of responsibility. Increasingly, signs of ethical integrity are emerging. For example, in Australia, Amanda Pike's move to “adopt” pensioner Betty Moore was embraced with enthusiasm by thousands who have come forward with tangible personal support for pensioners. ( http://au.todaytonight.yahoo .com/article/3561938/money /adopt-pensioner-update ). It seems that the public – at least in Australia – has had enough of the political bullshit artistry, and is voting with its feet to do the right thing.
*********
Below are the most recent records of foreign exchange reserves that I could find on the internet (all except India are as at December 2007. India's numbers are at June 2007)
Table 1: BRIC Nation Foreign Exchange Reserves as at 2007
| Country | Foreign Exchange Reserves US$ Billions |
| Brazil | $178 |
| Russia | $474 |
| India | $200 |
| China | $1,500 |
| Total | $2,352 |
The combined $2.3 trillion number should be compared with US Public Debt, which has moved as follows in the year to May 30 th 2008.
Table 2: United States Public Debt
| Date | Public Debt US$ Billions |
| June1 st , 2007 | $8,828 |
| May 30 th 2008 | $9,389 |
| Yr on Yr Increase | $561 |
Source: http://www.treasurydirect.gov /NP/BPDLogin?application=np
The US Public Debt is more than four times the combined Foreign Exchange Reserves of the countries which are supposedly going to drive the world economy going forward; and it rose by 6.3% for the year to May 2008. It is clear that this deteriorating trend in public debt cannot be allowed to continue. The party is over for the USA, but we should not underestimate the power of the US economy to heal itself. The US is the world's largest incubator of innovation.
Up to this point in history, the US Government has funded its deficits by issuing Treasury Bonds, and a significant proportion of these Treasury Bonds has been subscribed by its main trading partners (the oil producing nations and China). It needs to be remembered that a significant proportion of the interest payable on US Public debt is payable to foreign holders of US Treasuries.
Now, assuming the 10 year treasury yield remains constant at around 4.25% p.a., the interest payable on existing US Public Debt will amount to $400 billion a year. The technical signs are that interest rates may rise further and, on top of this interest burden, (much of which flows overseas) there's also the impact of oil price rises on the budget deficit (oil has risen from roughly $60 a barrel in January 2007 to $130 a barrel now) and the impact of a slowing US economy.
In light of the above, it seems very probable that both the US Trade Balance and the US Government Budget will remain in deficit for the foreseeable future.
All of this begs one particular question: “Assuming the oil price remains at these lofty levels or trends higher, how will the US Government pay for its future deficits – which are unlikely to be economically stimulative within the USA because the dollars are flowing offshore?”
In December 2007, the OPEC nations had US$3.5 trillion “under management” (source: http://www.zawya.com/story.cfm /sidZAWYA20071222122050 ) Will they use some of this money to subscribe for new US Treasury Bonds?
If you are prepared to devote an hour to watch the video at http://video.google.com /videoplay?docid=33402746971670 11147&hl=en
you will see Chaplain Lindsey Williams making three particular claims amongst others:
- In the 1970s, an oil field was found in Prudhoe Bay in Alaska that was as large as the Saudi Arabian oil fields.
- Information regarding this discovery was classified and the well was deliberately capped to create artificial oil shortages.
- Henry Kissinger made a deal with the Arab Nations (excluding Iraq and Iran) in the 1970s – whereby the USA agreed to buy Arab oil provided the oil producing nations re-invested a portion of this revenue in US Treasuries. In return, the US Government agreed to keep the Prudhoe Bay/Gull Island oilfield capped (assuming it exists).
I gave a significant amount of mind space to thinking about this video but, eventually, I concluded that Chaplain Williams was very likely fed information on a selective basis. Personally, for various reasons which will take too long to articulate here, I finally concluded that it was more likely that he was used as a pawn in a complex negotiating game, than that the claimed oil field exists.
Nevertheless, parts of his argument do ring true. The argument seems reasonable that the failure to secure Iraq and Iran's agreement very likely exposed the US Dollar to the whims of those countries' leaders. Saddam's move to price his oil in Euros probably did lead to the US invasion of Iraq.
The same article in which OPEC's $3.5 Trillion under management is mentioned also talks about how Iran is now selling most of its oil in Euros. But this information is known. The markets have already factored it in. Of course, I could be wrong, but the charts do not seem to be anticipating any invasion by the US of Iran.
It seems to this analyst that if the OPEC nations as a whole blink and break ranks, (by moving to price in Euros) then around $4 - $5 trillion of the world's Foreign Exchange reserves that are denominated in little green pieces of IOU paper will (at best) become highly suspect in terms of their intrinsic value and the dollar's acceptability as payment for future international settlements will evaporate. Clearly, if OPEC moves en mass to price in Euros, then the US Dollar Index will tank.
But this would be the equivalent of suicide bombing on a multinational scale. What would be the purpose of such irresponsible behaviour? There is probably unanimity amongst the world's central bankers (and the holders of those dollars) that the last thing the world needs is a tanking dollar.
Indeed, at present there is a technical argument that the US dollar is looking to bottom at around the current level – given the non-confirmation of rising bottoms in the oscillator and falling bottoms in the monthly price chart. (Chart source: Decisionpoint.com)
Conceptually, if the US Dollar were to be “bottoming” because interest rates were about to rise, then the US economy might be regarded as being extremely vulnerable. Over 2/3 of US GDP is driven by consumers. How will the US consumer cope with both high oil prices and rising interest rates?
One factor which might ameliorate this consumer vulnerability would be if the oil price were to pull back significantly. We therefore need to look at the charts of interest rates, oil and gold. Why gold? Because gold is supposedly a barometer of inflation. If interest rates are going to rise and oil is going to fall then we will experience a slowdown in inflation, and the gold price should fall in sympathy.
Okay, so let's do that (Chart's courtesy Decisionpoint.com):
The rising bottoms on the PMO of the monthly chart above seem to be indicating that it is only a matter of time before the 22 year downtrend line is penetrated (again) to the upside. It seems very likely that long dated yields in the USA have bottomed, and may rise in the foreseeable future
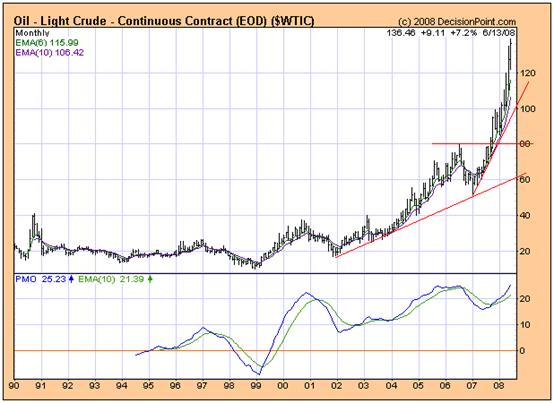
The chart above – of the monthly price of light crude oil – seems to be in what may be described as an exponential blow-off phase. This observation is validated by the seriously overbought PMO. Theoretically, exponential blow-offs typically end in collapses as the speculative frenzy in the market place abates and the forces of real supply and real demand reassert themselves. Arguably, the oil price has risen from $60 to $130 a barrel over the past eighteen months because of market speculation. If this turns out to be true (we will examine probabilities later), the oil price could pull back to the rising trend line at around $60 a barrel – and still be moving within a rising Primary Bull trend.
Hmm? Could it be possible that there is oil in Prudhoe Bay? Or maybe the claims of the existence of deep (and massively large) oil wells in Russia are true?
Well, let's look at the gold price. If the world economy is about to be saved by that particular miracle, then it should also be giving off technically bearish signals.
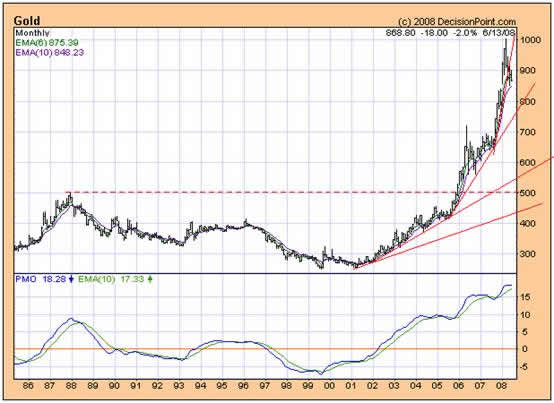
There can be no argument that the PMO of the above monthly chart of the gold price is seriously overbought. There can also be no argument that, technically speaking, a pullback to around $700 an ounce would be a healthy sign – in that the price would still be moving within the confines of a Primary Bull Market.
So, conceptually, rising interest rates could be offset by a falling oil price to keep the US consumer dazed but solvent. Furthermore, a falling gold price would indicate an abatement of inflation without the world economy going off the rails. The US consumer might muddle through, but will likely have to pull in their belts as the Government withdraws from its various wars and pays down its public debt over time.
What's the probability that the oil price will pull back?
Well, let's look at the picture in this way: If interest rates were to rise, AND the oil price were to remain high or continue heading north, then the US equity markets should be reflecting this underlying scenario and should be looking vulnerable.
Let's take another look at the ultra long term view of the Dow Jones Industrial equity market. The chart below (courtesy Decisionpoint.com) is an exceptionally important chart in my view.
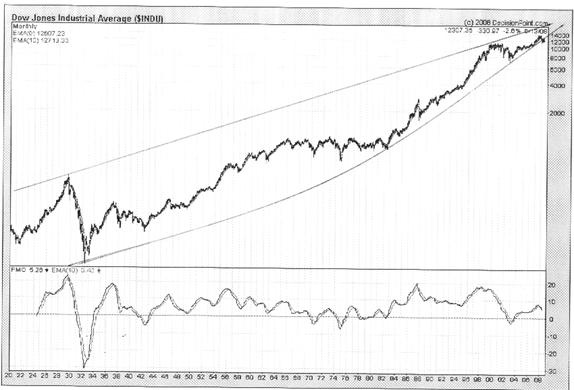
There have been two very significant developments over the past couple of months:
- The exponentially rising trend line has been penetrated on the downside – thereby indicating:
- There will be no exponential blow-off arising from hyperinflationary hysteria
- Under Bernanke, the era of Fed Driven asset price inflation is very likely drawing to a close.
- The PMO has fallen below its moving average and, in the process, is reflecting falling tops which serve as a non-confirmation of the rising tops in the price chart of the DJIA. The previous high in the Dow Jones Industrials is unlikely to be bettered in the foreseeable future
All in all, the above chart can be said to be in the early stages of a Primary Bear Trend, and it is an open question whether share prices are going to churn sideways or are going to head down in earnest.
When we take a closer look at the monthly chart of the Dow Jones Industrial Index below, we see that there may be significant support at around the 10,000 – 11,000 level.
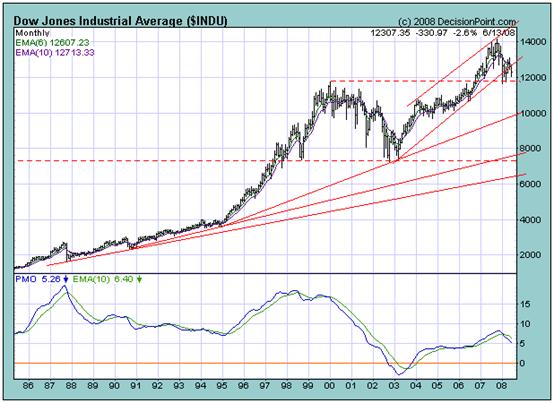
All in all, the evidence seems to be suggesting that the financial markets are not close to panic and, therefore, the oil price (and the gold price) might well pull back.
How could this be? If Chaplain William's argument regarding the oil field at Prudhoe Bay has a low probability of being true, what will cause the oil price to pull back?
There are four fundamental facts which, if factored into the analysis, serve to support the view that a pullback may be possible:
- Fischer Tropsch Technology: Oil can be synthetically produced from coal for less than $50 a barrel. SASOL in South Africa has been doing it for decades; and has been making profits in the process. The $130 per barrel price makes no sense in the first place. In a free enterprise world, at $130 a barrel for oil, FT technology represents a hugely profitable business opportunity.
- The Biofuels Security Act of 2007: Mandates 10 billion gallons of renewable fuel for calendar year 2010. That's about 3% of US annual consumption. Biofuel from algae is looking promising. The 10 billion gallons may be achievable without seriously impacting on food availability.
- Lack of refining capacity: The oil distribution companies cannot sell oil that has not been refined. The reality is that, for years – and even knowing about FT technology as a fall back position – the oil distribution companies have been allowing refinery capacity in the west to contract; and US refineries are being operated at levels which are dangerously close to capacity. Oil company managements may be ethically challenged, but they are not intellectually challenged. Why would they do that if it is possible to produce synthetic diesel using Fischer Tropsch technology? There can only be two “logical” arguments:
- They are deliberately manipulating the oil price upwards by creating artificial shortages. This would presuppose that they are too stupid to see the consequences that the man in the street thinks he can see. Eg That the oil markets are going to become dysfunctional, and the world economy could implode.
- The world has genuinely passed peak oil and the oil distribution companies have taken a view that alternative technologies will cope with this fact (More fuel efficient cars, electric cars, hybrid cars, biofuels, solar power, other)
- The Dow Jones Transports has been (and remains) exceptionally strong – as can be seen from the chart below
![]()
It has long been this analyst's contention that the primary reason for this strength has been that the oil industry (and those industries which hang off it) price their products and services in a manner that is calculated to preserve a constant percentage gross margin. Given that 90% of the US's transport is dependent on oil, the price:volume equation is highly inelastic. Volume does not fall off significantly as oil prices rise – and the consequence of this is booming dollar profits in the transport industry.
Conversely, if the market was expecting volume to fall off significantly because of lack of availability of oil (as opposed to lack of demand for oil) then the Dow Jones Transportation Index would be showing signs of serious vulnerability.
Everything considered, I think that the signs are far more subtle than they appear from a cursory surface analysis. In my view, as the weeks and months pass, the scenario that I have outlined in my novel – Beyond Neanderthal – is growing ever more probable. I argue in that novel that the world is not necessarily facing a collapse in its social and economic infrastructures. The conclusion that Beyond Neanderthal arrives at is that the world is about to come to its senses; and that humanity is facing a wonderful opportunity.
The political power base of the Western oil/banking industry is dissolving before our eyes and, in its place a new social paradigm and a new economic era will slowly emerge. The question is whether we will be bright enough to understand that the real driver of climate change is not CO2; it is our sun – the flaring activity of which may be about to begin waning from 2012 onwards. Are we bright enough to understand (and courageous enough to do something about it) that the paradigm of centrally generated electrical power needs to be changed to embrace locally generated energy?
Conclusion
The technical evidence seems to suggest that:
- US interest rates are about to rise
- Oil and Gold prices might well pull back sharply within the confines of their Primary Bull trends
- The reason for the likely pullback in the oil price may be related more to the emergence of alternative energy technologies than to the availability of oil fields which have not yet been announced/discovered
- The US equity market seems likely to consolidate for the foreseeable future, but is not showing signs of wanting to collapse.
It would seem that, within the equity markets, there will be a “churning” as some new era companies grow to replace legacy businesses that are losing traction
By Brian Bloom
The novel, Beyond Neanderthal , has arrived from the printers. Orders may be placed at www.beyondneanderthal.com and existing orders will be executed in the next few days.
Copyright © 2008 Brian Bloom - All Rights Reserved
Brian Bloom Archive |
© 2005-2022 http://www.MarketOracle.co.uk - The Market Oracle is a FREE Daily Financial Markets Analysis & Forecasting online publication.