


Uptown Slowdown: The Rich Are Slowing Their Spending Now, Too!
Economics / US Economy Jun 04, 2015 - 06:09 PM GMTBy: Harry_Dent

 Recent statistics show that the affluent are rapidly slowing in their spending. Economists are surprised, as usual. We’re not. The beauty of demographic trends is that they allow us to see changes in spending well ahead. It’s the single best indicator we have for the economy.
This is even more important in a time when many leading indicators no longer work, thanks to an economy artificially manipulated by quantitative easing. What we know from our research is that the demographic blows have already started to hit us since 2007, but that they’ll get markedly worse through 2020 and 2022.
With this information, we see some of the most important trends on the horizon that economists won’t until after they occur. They are:
- Dramatic spending declines throughout Europe — especially Germany, their “powerhouse.”
- The continuing slowdown in China’s workforce.
- A decline in spending for America’s biggest consumer, the affluent.
Let’s focus on No. 3. The top 20% in the U.S., who typically make $100,000 plus, account for over 50% of consumer spending. They are the ones that have continued to spend since the great recession — not the average household.
There are two reasons for this. The first is that the affluent control well over 90% of financial assets — like stocks — outside of primary homes owned. This sector benefitted the most from QE because it created inflationary bubbles in those assets.
The second and more important reason is that this sector peaks in its income and spending much later than most households. They tend to be more educated, meaning they go to school longer — as do their kids. In other words, their peak spending is delayed… and hence, much stronger.
So what we’re just starting to experience now… is the pressure of that much stronger consumer force suddenly decreasing their spending. And it’s part of a much larger demographic trend we’re in.
Here’s a chart on household spending I have used many times before. It bears repeating as it is one of the most fundamental illustrations we have on demographics.
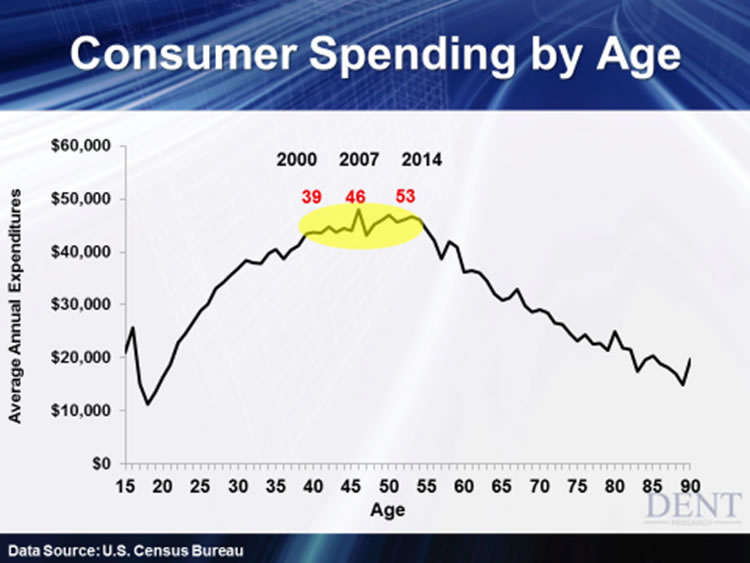
People spend sharply more between age 19 and 39 as they get married, have kids, and build their households. Those between age 27 and 41 purchase most of the homes, which is the largest and most leveraged purchase they ever make. They enter a high plateau of spending, on average, at age 39, hit the peak at 46, and decline sharply after 53. It’s that plateau, between age 39 and 53, that’s so important.
The generation responsible for the most consumption in our economy, the boomers, first hit that plateau in 2000. Wages adjusted for inflation have been flat to down ever since. Even the stock market, when adjusted for inflation, has made little progress — and yes, including the recent, dramatic stock bubble which appears ready to top.
With the peak spending that came at age 46 — in 2007 — our economy had to come off that high, literally. Sales in home furnishings, the second largest durable goods and debt-leveraged sector, hit that same year as our demographic indicators said they would.
When the great recession followed, magnified by the subprime crisis, the Fed pulled out the artillery along with central banks around the world. Still, against demographic trends, this unprecedented stimulus has been minimally effective in propping up a slowing economy.
We hit the end of this plateau in 2014 when the peak boomers hit age 53. As you can see, their spending will decline more dramatically in the years ahead. This is when the real demographic cliff hits. Nothing will entice them to spend what they did in that 39 to 53 year plateau. Nothing.
That means, when the biggest generation falls off the demographic cliff… you can pretty much guess what happens!
We’ve been forecasting 2015 will see a slowdown in consumer spending, especially in the affluent sector. Auto sales is the last major durable goods sector to peak at age 53, so it will join housing and furnishings to head down from 2015 forward. Auto sales have been flat since their peak in May 2014. We expect more dramatic declines in the months and years ahead, especially in the luxury sectors.
Statistics from Unity Marketing show that those who make $100,000 to $250,000 spent 10% less on luxury goods and services in Q4 2014 than Q4 2013. Worse, the $250K plus segment spent 17% less. Those are massive drops!
Don’t underestimate how big of a deal this is. Our economy and markets are overdue for a reality check. It’s why our third annual Irrational Economic Summit this September will largely focus on the effects the boomers will have on our economy and the value of our assets for the next several years.
We continue to expect a larger correction to begin this summer and that by early 2017 stocks will see a crash even greater than they did in 2008/2009. I hope to see you at the conference, as we’ve gathered over a dozen of the best economic minds to show you how to survive and prosper through the demographic cliff ahead.
Harry
Follow me on Twitter @HarryDentjr
Harry studied economics in college in the ’70s, but found it vague and inconclusive. He became so disillusioned by the state of the profession that he turned his back on it. Instead, he threw himself into the burgeoning New Science of Finance, which married economic research and market research and encompassed identifying and studying demographic trends, business cycles, consumers’ purchasing power and many, many other trends that empowered him to forecast economic and market changes.
Copyright © 2015 Harry Dent- All Rights Reserved Disclaimer: The above is a matter of opinion provided for general information purposes only and is not intended as investment advice. Information and analysis above are derived from sources and utilising methods believed to be reliable, but we cannot accept responsibility for any losses you may incur as a result of this analysis. Individuals should consult with their personal financial advisors.
© 2005-2022 http://www.MarketOracle.co.uk - The Market Oracle is a FREE Daily Financial Markets Analysis & Forecasting online publication.