


UK House Prices, Immigration, Population Growth and Election Forecast 2015
News_Letter / UK General Election May 18, 2015 - 02:41 PM GMTBy: NewsLetter
 The Market Oracle Newsletter April 15th, 2015
Issue # 7 Vol. 9
UK House Prices, Immigration, Population Growth and Election Forecast 2015
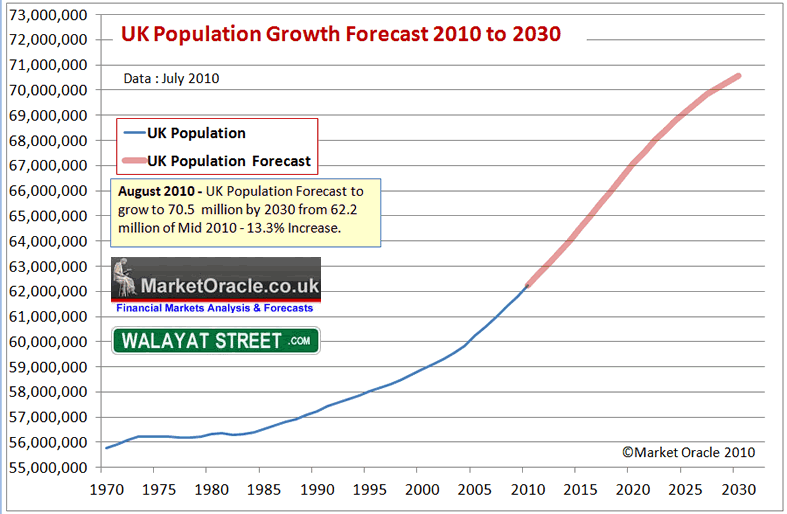
Dear Reader, Britains housing market pressure cooker is one of limited new build supply that consistently fails to keep pace with new demand that typically tends to average twice the rate of required supply resulting in an worsening housing crisis each year which explains why ivory tower academic theories of a UK house prices bubble that is always imminently destined to burst persistently fails to materialise. Instead the reality is one of house prices relentlessly grinding ever higher whilst people in other nations can only look on in puzzlement as to how can UK house prices continue to defy gravity with an ever escalating house price to earnings ratio that on an average basis stands at X5, far beyond that of virtually every other western nation. Therefore this analysis revisits the UK's near unique immigration driven population growth demographic drivers that contrary to bubble bursting expectations could yet continue to persist for several more decades! UK Population Growth Forecast My long standing forecast is for the UK population to grow from 62.2 million as of Mid 2010 to at least 70.5 million by 2030 as illustrated below: UK Population Growth and Immigration Trend Forecast 2010 to 2030) The assumptions being factored into the UK population growth forecast are for a natural UK population growth rate of births exceeding deaths of 0.33% per year (current 200k), coupled with net average current immigration trend of 240k per year, supplemented with climate change refugees averaging 50k per year from 2015 onwards extrapolates into the following trend forecast over the next 10 years that targets a rise from 62.2 million as of mid 2010 to 67 million by mid 2020, and should the same trend be maintained beyond 2020 then the UK population could rise to above 72 million by mid 2030. However in all probability the country will not experience the post 2020 trend due to several converging factors including political pressures, capacity constraints and the UK's relegation in the economic prosperity leagues. Which implies a tapering off of net immigration in favour of natural growth which implies a lower total of nearer 70.5 million by 2030 as illustrated by the below graph.
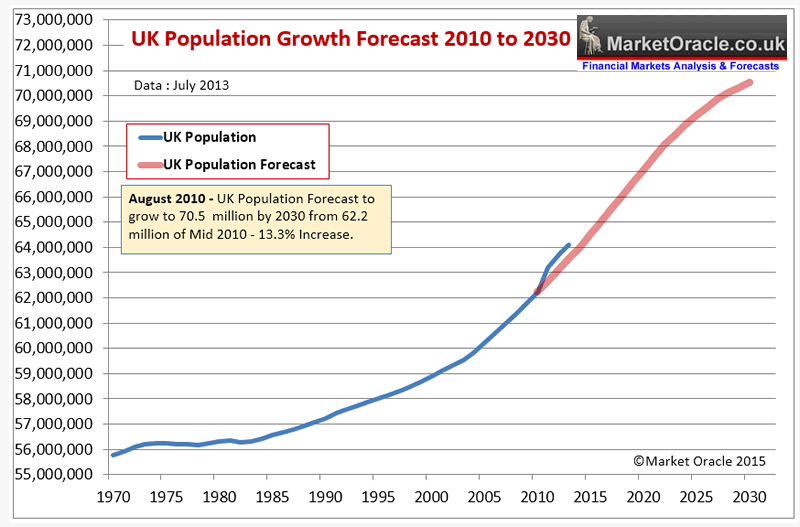
The updated UK population graph shows an actual trend trajectory as per the most recent ONS population data into Mid 2012 of 63.7 million and estimate into Mid 2013 of 64.3 million, which suggests that the UK population could increase by an additional 4 million by 2030 as a consequence of what amounts to continuing out of control immigration and high birth rate that in total would translate into a population increase equivalent to 15 cities the size of Birmingham.
Labour Governments Immigration Catastrophe It cannot be under stated how disastrous were the immigration policies of the last Labour government and their ineptitude in gauging the consequences of in terms of opening the flood gates at a time when many other more european nations such as Germany and France restricted immigration that acted as a funnel that sucked in over 2 million eastern european immigrants into Britain's debt fuelled economic boom that has resulted in what amounts to catastrophic out of control immigration that is more than TWENTY TIMES that which Labour stated would take place, policies that as a consequence of being a part of the EU are STILL contributing towards out of control mass immigration that even former senior Labour Government Ministers such as former Foreign Secretary Jack Straw are stating were 'completely catastrophic' - " The predictions were completely catastrophic, I mean they were wrong by a factor of ten, in other words it wasn't 13,000 per year but it was something like 130,000 a year" - Jack Straw The actual rate of annual immigration averaged 250,000 per year or near 20 times the Labour governments propaganda that continued right upto the point Labour dumped the crisis in the lap of the Coalition Government in May 2010.
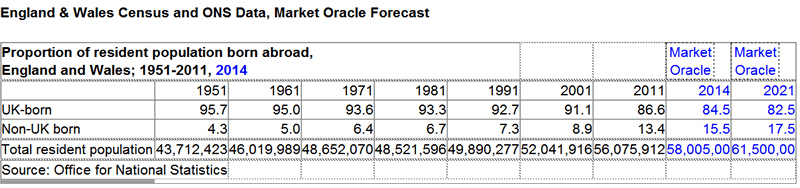
Coalition Governments Failure to Control Immigration The latest immigration statistics out of the ONS once more illustrate the magnitude of the ConLib Coalition governments own failure to control immigration where to all intents and purposes the past 5 years have just marked a continuation of the Labour catastrophe that set in motion a 15 year long immigration mega-trend for importing approaching 4 million people, where approx 90% of the adults were expected to vote Labour (low pay and on benefits such as tax credits). When David Cameron took power in 2010 he promised that he would cut net immigration towards the end of the parliament to the tens of thousands from the then disastrous annual figure of 205,000, instead the latest data from the ONS shows that net immigration has continued to SOAR to a level far higher level than in 2010 to now stand at 298,000 per year. "Overall, net immigration would be kept in the tens of thousands, rather than the current rate of hundreds of thousands”. - David Cameron 2010 A study by the University of Oxford concludes that England's migrant population has increased by 565,000 over the past 3 years of which 2/3rds are from the EU. However, in my opinion Oxford University grossly under estimates the number of immigrants as illustrated by the most recent ONS statistics which show a near 300,000 net migration to the UK over just one year, where the total over the past 3 years is near 750,000. So in reality the probable actual increase in migrant population of England and Wales is likely to be about 1/3rd higher than the Oxford University guesstimate. The study also reported that some 8 million foreign born people now reside in England, where the greatest concentration is in London (3.2 million), and immigration hotspots right across England including the South East 1.1 million, East 700k, North West 625k, West Midlands 500k, York's & Humb 515k, and the East Midlands 495k. Clearly London has the largest foreign born population concentration at 3.2 million, approaching 40% of the cities population and with the South East accounts for 50% of the increase in immigrant populations of the past 3 years However, here the fatal flaw is NOT taking into account the ILLEGAL immigrant population of approx 800k and including ONS data is likely to be 1 million higher therefore totaling at least 9 million or at least 15.5% of England's population against just 13.4% 3 years ago (2011 census), an huge increase in just 3 years in what is an accelerating trend as the census data for England and Wales from the preceding years illustrates.
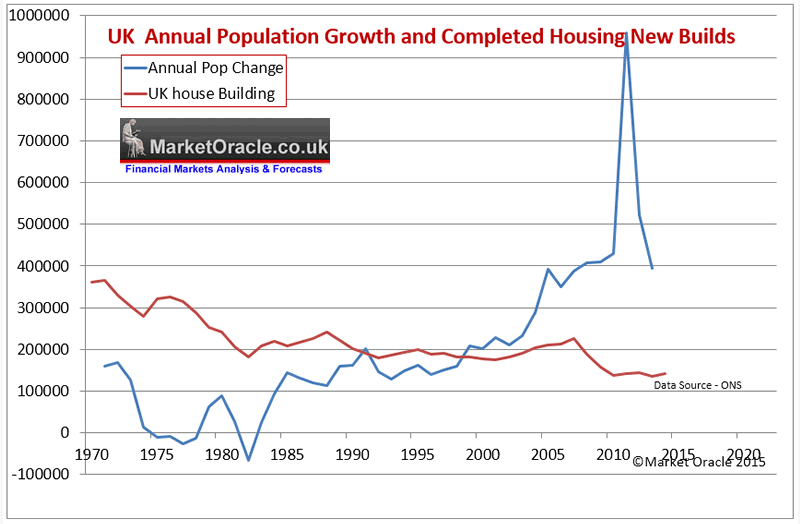
The bottom line is that Britain's immigration crisis is ACCELERATING and is EXPONENTIAL where the Conservative Coalition Government has failed to do anything to control what remains out of control immigration. And remember that the official statistics do not include illegal immigration totaling at least 800,000. The Politics of Mass Immigration The Leaders and representatives of both major parties have been busy making statements in the run up to the May general election promising to control immigration in the future, however these amount to nothing more than bare faced lies when one considers the real fundamental drivers for immigration because if the politicians were really serious about controlling immigration than they would have already done so! Labour supports unlimited immigration because the vast majority of immigrants (90%) will tend to vote Labour i.e. be politically left of centre, therefore Labour sees immigration ultimately in terms of hundreds of thousands of new Labour voters each year who will ensure future election victories. Labour's strategy has therefore been highly successful as in a little over 10 years it has changed many constituencies in favour of voting Labour to the point where it has now become near impossible for the Conservatives to win outright elections such as the landslides achieved by Margaret Thatcher during the 1980's. Conservatives support immigration because it is highly profitable for their pay masters - big business, as the influx of migrant workers will tend to drive down wages for all workers thus deliver higher profits for business. Academic economists may rightly argue that by doing so businesses will ultimately erode their own profits as workers who earn less also spend less. However what academics fail to appreciate is that the state steps in to fill the gap by subsidising workers through tax credits and funding the lifestyles of some 9 million people who are economically inactive all of which is paid for by money conjured out of thin air i.e. government debt that is not backed by any economic activity that acts to inflate the economy, and thus corporate profits which are leveraged to inflation. Therefore one should realise that high net immigration is in the interests of both major political parties both in terms of votes and for those that bankroll the parties, which means that neither Labour nor Conservatives will actually do anything significant in respect of controlling immigration, so everything you are hearing in the mainstream media from the politicians such as Cameron promising a EU referendum in 2017, some 2 years AFTER the next election is purely smoke and mirrors propaganda to mislead the population into thinking that something will eventually be done about Britain's immigration crisis. So whilst each political party has been busy announcing a string of policies to control immigration, but they will break ALL of their immigration promises just as they have done before because it is not in either major parties interests to control immigration. In fact the only party to seriously and consistently advocate immigration controls is UKIP. UK House Building and Population Growth The consequences of net immigration of near 4 million people can most visibly be seen and felt in the UK housing market where house building has abysmally failed to keep pace with Britain's population explosion, a crisis that was further exacerbated following the financial crisis that induced a slump in house building as the below graph shows the UK annual population change against annual new housing build completions.
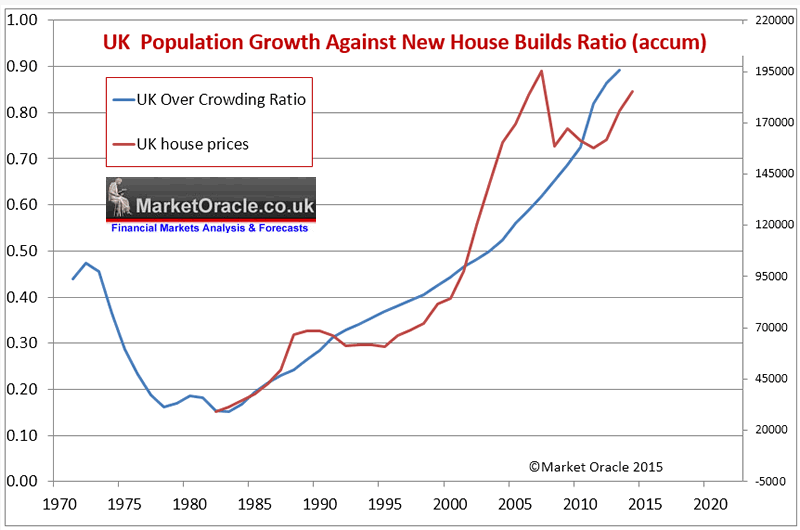
The graph illustrates two a major long-term shifts that took place in the UK housing market dynamics since 1980. 1. 1980's Right to Buy Margaret Thatchers 'Right to Buy' your Council house policy appears to have acted as a huge disincentive for local councils to build properties, where council house building literally collapsed from 100,000 per year in 1980 to just 20,000 per year by 1990 and by 1995 had fallen to less than 2,000 per year, where local authority house building has languished ever since, even under 1997 to 2010 Labour government as Right to Buy has acted as a huge disincentive for local authorities to build properties that they may be forced to sell off within a few short years. 2. Immigration Explosion By 2000 the annual increase in population as a consequence of Labours immigration policies started to far exceed the number of new builds that ended the preceding overall trend for construction to exceed population growth in terms of addressing the UK's long standing housing shortage, especially considering that the average size of households has continued to shrink falling from 3.1 in 1960 to just 2.24 in 2014 (one of the lowest in the world) as a consequence of the increase in single person households and single parent families. Whilst instead of doubling house building during the immigration crisis the near exact opposite has taken place as far fewer houses were built each year during the noughties. The ratio of average household size is still trending lower which means that even if the UK population suddenly stopped increasing then the falling household size ratio towards 2.15 by 2030 would still imply EXTRA demand for 1.25 million properties to be built just to stand still. The below graph further illustrates the ratio between the accumulative change in population since 1970 against the accumulative number of new housing builds also since 1970 as an over crowding ratio overlayed with UK house prices that illustrates the worsening trend in the level of over crowding due to inability of new supply to meet new demand that just keeps accumulating each year.
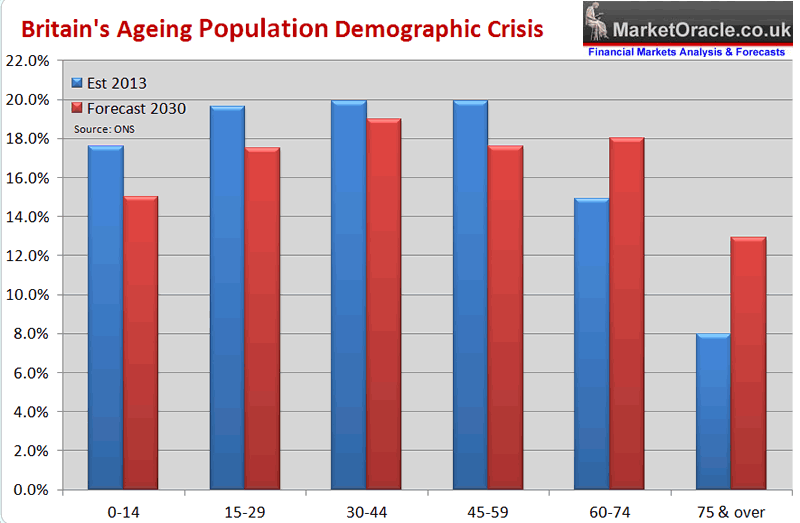
This better illustrates the change in trend that started to take place during the mid 1980's that coincided with the Thatcher governments reversal of the policy for the construction of social housing and implementation of the right to buy scheme that to date has resulted in the sale of over 2 million socially owned local council housing that fueled the property boom of the nineties AND noughties, the trend that was set in motion was for the inability of supply to keep pace with population growth which ensured continuously persistent upward pressure on house prices that despite the great recession of 2008-2009 still showed an accelerating trend as new build supply that currently stands at an estimated 140k per year is set against government estimates for a requirement of at least 250k properties per year, with 300k a more realistic estimate when the trend for a falling household size is taken into account, which thus ensures that the UK's over crowding situation is expected to continue to worsen year on year going forward, especially if the size of average households continues to shrink which would require about 70,000 new builds per year even if the population stopped increasing. And this analysis does not even consider the fact that each year the total number of properties remaining empty continues to rise either as a consequence of being for sale, let, legal issues or falling derelict. This totals now more than 1 million empty properties at any one time, a number which despite demand looks set to continue to rise as many of the derelict buildings will only come back on the market when they have been demolished and rebuilt, so erroneously counted as new builds when they should be classed as rebuilds. The bottom line is that the UK housing crisis is being primed to explode! Britain is literally being sleep walked towards having to painfully deal with its extreme consequences due to the failure of successive governments to take pre-emptive action before the crisis explodes, which it will probably do some time before the 2020 General Election, forcing politicians to think the unthinkable in an attempt to bribe voters. Implications for House Prices New build supply plays an important role in the housing market as it tends to average at approx 10% of the total number of annual transactions, which is more than enough to have a significant effect on the UK housing market especially as supply over recent decades has been consistently below that which is deemed necessary to meet the demands of a growing population which means that the UK housing market was never destined to replicate the housing busts of countries such as the United States or even closer to home of countries such as Spain, where that housing bust has prompted many hundreds of thousands of British ex-pats to cut their losses and return to the UK, closely followed by unemployed Spanish and other PIIGS citizens seeking employment in a far more liberal and robust UK jobs market and thus introduce new demand into the UK housing market as they seek accommodation. Other examples include the crackpot French tax policies that led to an exodus of 450,000 French professionals to London. This suggests that the often put forward academic standards in terms of valuing the housing market affordability ratios such as X3.5 salary towards the likely path for the UK house prices does not take into account that of new demand against new supply trend that implies affordability ratios look set to be pushed ever higher to new trend extremes, and therefore supporting long-term rising price trends for UK house prices in real terms, i.e. expensive UK house prices look set to be here to stay for as long as the lack of new supply exists, especially as the UK population is expected to grow by at least another 5 million over the next 10 years and probably exceed 6 million which demands at least an extra 2.5 million homes to be built which is set against an realistic estimated construction of just 1.4 million new homes, which means UK over crowding is going to continue to get much worse and thus drive house prices ever higher regardless of what the academics say should happen. The bottom line is Britain's over crowding ratio insures that no matter what the arguments are put forward by academics that most people can no longer afford to buy so house price rises must be unsustainable, instead the UK population growth fundamentals are such that their arguments just do not matter, the only thing that can effect this fundamental trend is if the UK literally doubled the number of houses built per year, and even then it would not result in a fall in house prices but tend to index house prices to inflation. But off course that is not going to happen, the UK is not going to build anywhere near 300,000 homes per year, as the reality is that for most years UK house building will be short by as much as 150,000 completed new builds each year which just compounds the housing market demand vs supply pressure and thus exerts further upward pressure on house prices. Britain's Demographic Time Bomb Has Gone Off! Britain's demographic crisis as illustrated by an ever growing ageing population that despite an increasing number of workers due to immigration cannot maintain ratios of the past, where 20 years ago there were 8.9 million pensioners against 28 million workers or a ratio of 3.15 workers to every retiree (15.5% of the total population), today there are over 11.8 million pensioners to 30.9 million workers, a ratio of 2.61 to 1 (18.45% of the total population). Britain's growing elderly population demanding an ever greater share of the economic pie that puts an ever increasing burden on the welfare state services such as the NHS that will continue to severely impact the economy.
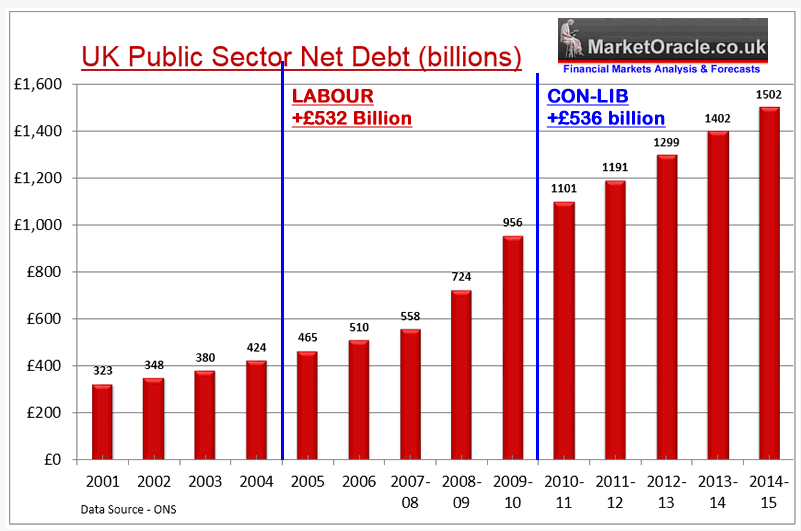
There is no end in sight to Britain's demographics crisis as an ageing population looks set to see the number of retirees increase from approx 11.8 million today to 13.5 million by 2020 the impact of which is partially being offset by Britains rising population from 62 million (2010) to at least 67 million by 2020, which whilst putting Britain in a far better state than many other countries who's total population and worker base is already shrinking as well as experiencing an increasing ageing populations such as Japan, however an 8% increase in the total population against a 17% increase in retirees is not going to offset the impact of the increasing number of retirees as the ratio of workers to retirees continues to fall, especially as this trend looks set to continue to 2030 and beyond by which time the number of over 75's looks set to literally double in number, rising from 8% of the population today to more than 13% and in total approx 25% of Britain's population will be over 65 which suggests an unbearable ratio of 1.9 workers per retiree 1, which implies that huge amount of purchasing power of workers will be lost over the next 20 years. The consequences of Britain's demographics are as I pointed out over 5 years ago in the Inflation Mega-trend ebook of Jan 2010 (FREE DOWNLOAD), that governments only ever have one solution which is to PRINT MONEY be it called debt that will never be repaid or QE or a multitude of other examples such as Funding for Lending, and the consequences of the perpetual exponential money printing is as I have written of on a near monthly basis is for continuous exponential inflation. This is why whenever I hear warnings of deflation, I consider the proponents as being delusional because there will never be persistent DEFLATION! Impact on House Prices The impact of the demographics crisis on the UK Housing market is suggestive of increasing supply from the mid to upper range of the UK housing market as many people approaching retirement will have during their working lives looked on their homes as a means of providing for them in their retirement as they expected the rise in house prices as a consequence of inflation and economic growth to result in a profit far in excess of any outstanding mortgages at the time of retirement and in most cases they will have played the property market wisely as many will be sitting on small fortunes, especially those that bought in the South of the England 30 or even 20 years ago. Therefore a significant number of retirees look set to continue to either downsize or move into retirement homes or the new retirement villages that have been springing up, which will in part free up supply to put a dampener on rampant house price inflation of what we saw during the last boom whilst INCREASING demand for smaller properties in retirement towns and areas of the country such as sea-side towns. Furthermore the psychology of seeing ones property as a retirement investment is widespread amongst all ages so continues to act as an encouragement to buy as people who cannot ever imagine that properties will ever yield less at the time of retirement than they do when bought, but instead the mindset is fixated on what has already come to pass for their parents and grand parents generations. In addition to this we have the wage slaves with less real terms disposable income to pay towards housing costs in terms of mortgages which on face value implies a persistent real terms deflationary outcome for UK house prices over the next 20 years. However this has to contend with out of control immigration coupled with domestic population growth as immigrant couples tend to have larger families which coupled with the benefit culture baby making factories will result in at least 10 million extra people, a trend that is more than capable of overcoming the deflation as a consequence of the ageing population that ultimately has to imply persistently high real rates of inflation not just for house prices but for sectors right across the economy. Furthermore as more of the benefits for life claimants are increasingly encouraged or forced into work, in addition to many more retirees continuing to work in some capacity will improve Britain's productivity which coupled with ongoing exponential technological advances will mean that a forecast ratio of workers to retirees that is unsustainable today could become sustainable 20 years from now which ultimately translates in workers being able to support a greater proportion of their wages being spent on housing costs in terms of affordability than is the case to today, which is why those fixated on affordability ratio's as compared against the past will continuously find themselves wrong footed, as ratios get ramped ever higher from 20% of income 20 years ago to 1/3rd of income today to 50% of income in 10 or so years time. Therefore the message being painted by this demographics analysis supports my long standing view that one of the only ways for people to leverage themselves to the exponential inflation mega-trend is to be exposed to assets such as housing and not only that but whenever prices fall due to fluctuations in the business cycle even if not in nominal terms but just in real terms (after inflation) than buyers should seize the opportunity presented because the over riding trend is for rising house prices over the next 20 years, a doubling then tripling in house prices by 2030! Where ALL of the risks are to the UPSIDE, i.e. out of control inflation which may in its immediate aftermath result in a real terms drop but which would sow the seeds for the next ramping higher in house prices just as the Great Recession house prices depression has resolved into today's bull market. Political Parties and House Prices Where house prices are concerned the key driver is the inflation consequences as virtually ALL political parties propose the same policies for inflation inducing deficit spending financed through printed money be it called QE or government bonds. Even the austerity coalition has shown itself to be far from that in truth for in nominal terms the Coalition government has printed the SAME amount of debt as the Last Labour government did.
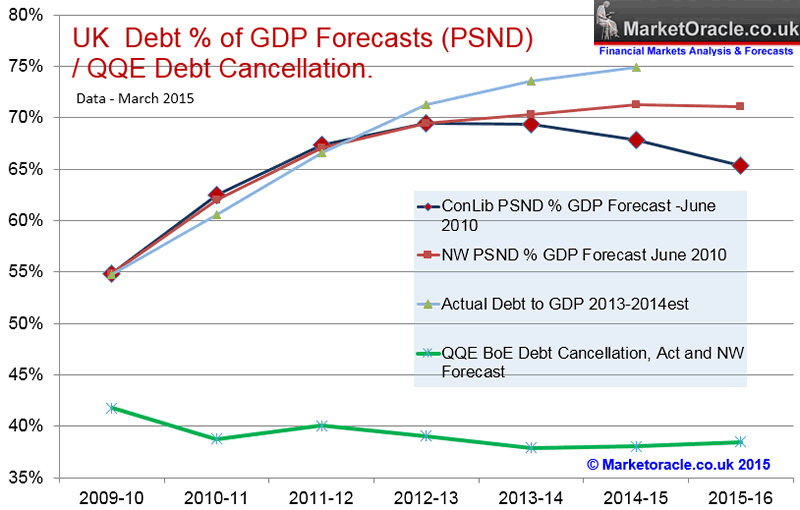
Even debt as a % of GDP has risen under so the called economic austerity coalition government to 75% which is some 7% above where ConLib originally forecast it would be.
Therefore the inflation mega-trend will continue its inexorable climb around which asset prices such as stocks and housing oscillate. So no matter what form the next government takes, all of the fundamentals will remain in tact for rising house prices for the duration of the next parliament. So where the parties are concerned it boils down to degrees of money printing inflation i.e Labour / Lib Dems will print more than Conservatives, and the SNP a lot more with the Greens barmy policies destined to hyperinflate! Where it is only UKIP, given severe immigration policies would impact on the UK house prices bull market though of course they say one thing whilst campaigning and would likely do other when in power, so yes they too will print money too to buy votes. For housing market election bribes we only need to look at the March budget announcement of the Help to Buy ISA (savings account), that for every £200 saved will have £50 added to by the government i.e. a 25% government house buying deposit subsidy that currently converts into a maximum of £3,000 per prospective home buyer (£12k total deposit) that I am sure will be raised annually, and which for couples implies a £6k subsidy. Which acts to boost DEMAND and this add further fuel to the UK house prices bull market that illustrates just one mechanism for the government printing money to inject directly into the UK housing market via voter bribes. And the just published Conservative manifesto centre piece is to extend the near 35 year right to buy your council house scheme (over 2 million sold) to 1.3 million housing association tenants so that they too may buy their homes at deep discounts of as much as 70% / £102,700 per property in London and £77k for the rest of the UK. The starting discount for housing association homes after 3 years of tenancy will be 35%, rising by 1% per year, and 50% for flats rising by 2% per year. Though I don't see how this would exactly work because the Conservatives are proposing to sell homes they do not own, so may face stiff resistance from housing associations. Additionally the Conservatives will seek to force councils to sell their remaining most valuable properties estimated at 200k at the rate of about 15k per year. Clearly both policies are aimed at attempting to bribe Labour leaning renting voters into becoming owner occupying Conservative voters as £77k to those outside London is a pretty big bribe! That and forcing the sale of the most valuable council houses is aimed at bolstering the vote in Conservative voting constituencies as that is where the most valuable council housing stock will tend to be situated.
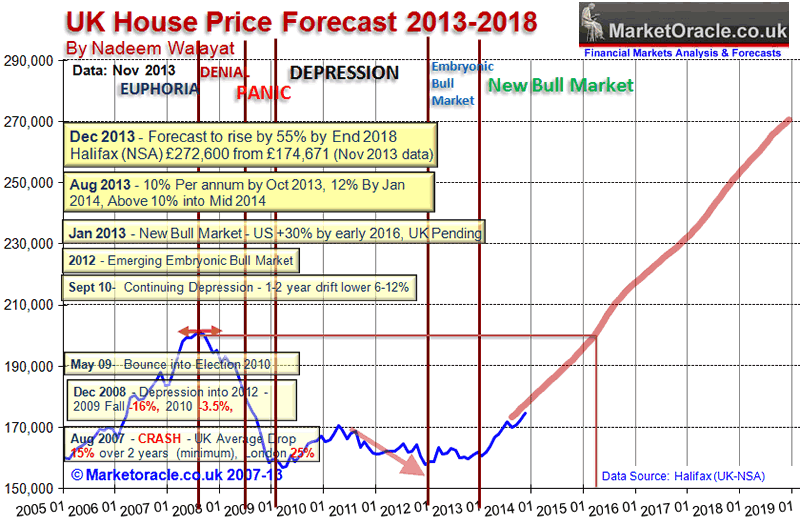
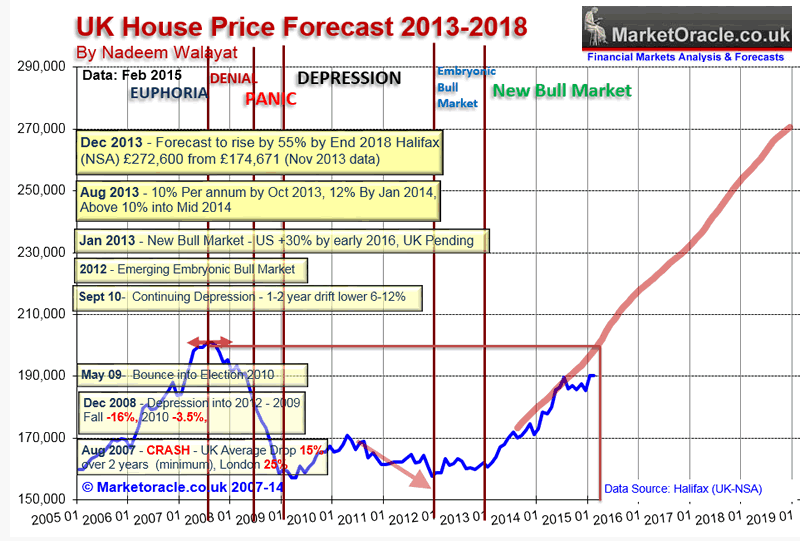
This will mark just the latest of a whole stream of continuous house prices boosting voter bribes that all governments engage in as the recent March Coalition budget illustrates with the announcement of the Help to Buy ISA (savings account), that for every £200 saved will have £50 added to by the government i.e. a 25% government house buying deposit subsidy that currently converts into a maximum of £3,000 per prospective home buyer (£12k total deposit) that I am sure will be raised annually, and which for couples implies a £6k subsidy. Which acts to boost DEMAND and this adds further fuel to the UK house prices bull market that illustrates just one additional mechanism by which the government prints money to inject directly into the UK housing market so as to bribe voters. The cost of today's voters housing market bribe will be at least £5 billion a year, and probably several billions more a year when the extra cost in housing benefit paid out in rent to private landlords has been factored into the equation. Private Rental Sector Crisis To date approx 40% of the right to buy council homes have ended up in the hands of private landlords who then rent out these properties to those on benefits or low incomes. So whilst Council house tenants and soon to join them Housing Association tenants are in receipt of 70% discounts (bribes) of upto £102,000! Those in private rental accommodation get NOTHING! In fact the rents in the private sector tend to be substantially higher than for social housing and the properties also on average tend to be in far poorer state of repair. Therefore at the end of the day the winners will be private landlords as the supply of buy to let sector properties increases. Meanwhile those waiting on the ever expanding housing lists are going to face even less choice as now even housing association properties will soon start to evaporate so that all that will be left will be some 6 million private landlord rental properties. The big question mark is what bribes will the politicians come up with to appease the 6 million private rental households? Will a future government announce the right to buy your private rental property, especially as it would be a relatively easy votes winning calculation for a left of centre party to make. Something for today's would-be landlords to ponder the consequences of as they mass property empires that they could be forced to liquidate. UK House Prices 5 Year Forecast It is now 15 months since excerpted analysis and the concluding 5 year trend forecast from the then forthcoming UK Housing Market ebook was published as excerpted below- UK House Prices Forecast 2014 to 2018 - Conclusion This forecast is based on the non seasonally adjusted Halifax House prices index that I have been tracking for over 25 years. The current house prices index for November 2013 is 174,671, with the starting point for the house prices forecast being my interim forecast as of July 2013 and its existing trend forecast into Mid 2014 of 187,000. Therefore this house prices forecast seeks to extend the existing forecast from Mid 2014 into the end of 2018 i.e. for 5 full years forward. My concluding UK house prices forecast is for the Halifax NSA house prices index to target a trend to an average price of £270,600 by the end of 2018 which represents a 55% price rise on the most recent Halifax house prices data £174,671, that will make the the great bear market of 2008-2009 appear as a mere blip on the charts as the following forecast trend trajectory chart illustrates:
In terms of the current state of the UK housing bull market, the Halifax average house prices (NSA) data for Feb 2015 of £190,113 basically shows that the UK housing bull market paused from August to December 2014 before resuming its bull run in January. House prices are currently showing a deviation of 4% against the forecast trend trajectory. In terms of the long-term trend forecast for a 55% rise in in average UK house prices by the end of 2018, if the current deviation continued to persist then this would result in an 15% reduction in the forecast outcome to approx a 40% rise by the end of 2018.
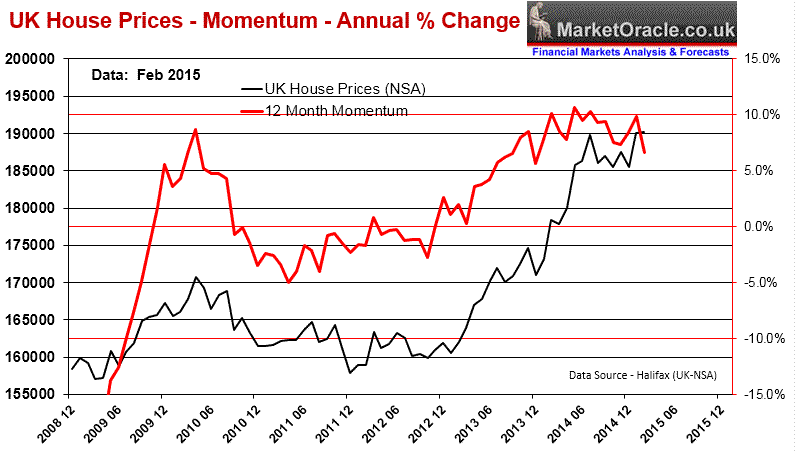
UK House Prices into the 2020's Looking beyond my existing five year forecast covering the period 2014-2018, that after 7 years of relative economic pain (2008-2014) as illustrated by the cost of living crisis, Britain is at the beginnings of a 7 year economic boom (above trend growth) that can only continue to drive the UK house prices bull market to well into the 2020's, for which I at least expect an average price increase of 10% per annum, that's a minimum 70% price rise on current house prices! Details on this to come over many more years so ensure you are subscribed to my always free newsletter to get in-depth analysis and detailed trend forecasts in your email in box. Implications for Election 2015 The following graph further illustrates the fall in momentum during the second half of 2014 and that this years surge to back above 10% has already evaporated as momentum has now slowed to +6.6%, so it appears the Coalition government will miss setting a new UK average house prices record high just prior to election day, probably due to ongoing weakness in house prices in the South East.
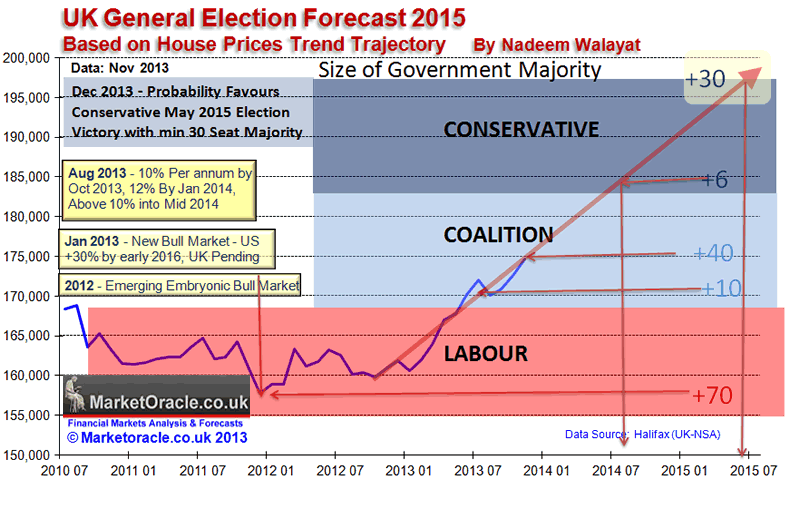
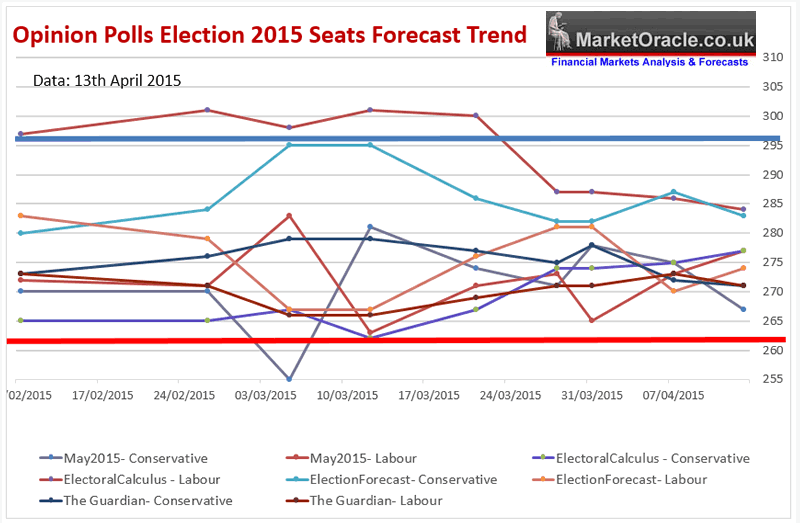
Therefore can expect a continuing slowdown in house price inflation during the summer months. In fact the momentum trend is likely to be very similar to Labours 2010 house prices mini-election boom that I had started to warn to expect from mid 2009. Though at this point I am not expecting a similar post election collapse to -5% as that was as a consequence of Labour going for broke on a near £160 billion annual deficit debt printing binge. Whilst the most recent polls are now marginally putting Labour ahead of the Conservatives. However my long standing analysis of seats vs house prices trend trajectory painted a picture for a likely probable Conservative outright general election victory. 16 Dec 2013 - UK General Election Forecast 2015, Who Will Win, Coalition, Conservative or Labour? The following graph attempts to fine tune the outcome of the next general election by utilising the more conservative current house prices momentum of 8.5% which has many implications for strategies that political parties may be entertaining to skew the election results in their favour.
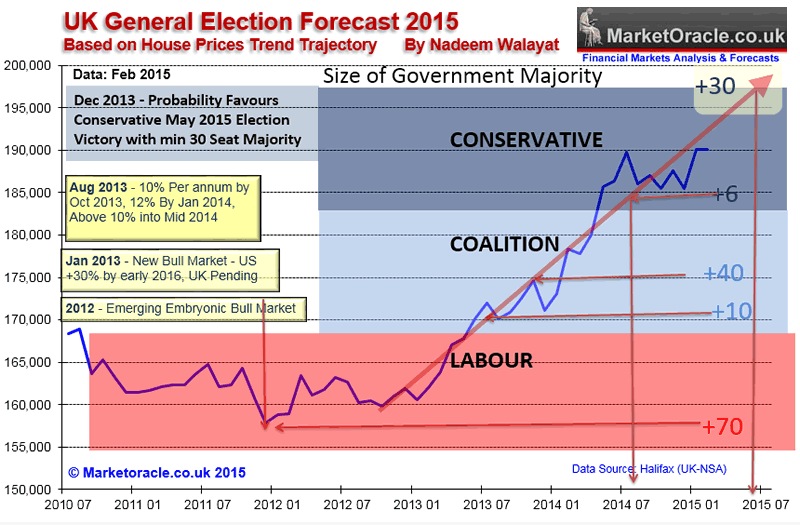
The the key implications of the above graph are -
The updated election seats trend graph illustrates that the Conservatives are trending towards achieving a single digit outright majority election win which NO ONE, and I mean no serious commentator / analyst either has or is currently advocating, so it would come is a big shock to pollsters on election day!
Opinion Polls Election Seats Forecasts Last weeks decision to go on the personal offensive against Ed Miliband may have seemed like a good idea at the time amongst Conservative party strategists but the personal attacks suggesting that Ed Miliband would stab the UK in the back just as he did to his own brother David by being prepared to scrap Trident in exchange for SNP post election support was initiated by Tory Defence Secretary Michael Fallon, a statement that senior Conservatives from the Prime Minister down refused to criticise. “Ed Miliband stabbed his own brother in the back to become Labour leader. Now he is willing to stab the United Kingdom in the back to become prime minister.” “We saw in that leadership election just what he would do to get into power. We saw what he did to his own brother. We need to know what he would do. "We can't be sure what kind of backstairs deal he is likely to do with the SNP... that is the uncertainty."
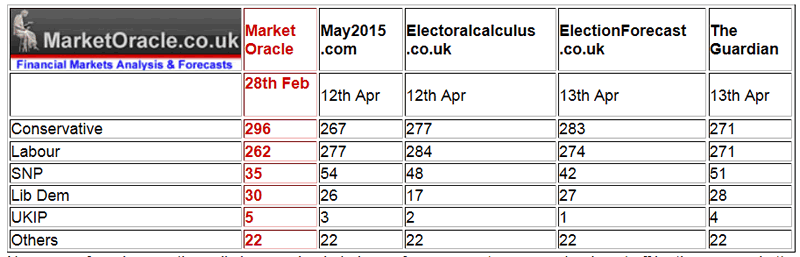
Now some five days on the polls have swing in Labours favour as voters were clearly put off by the personal attacks against the Labour leader. Whilst today Labour published their manifesto (election bribes booklet) which I am sure the political pundits will go through with a fine tooth comb. Though the strong probability for a hung parliament makes manifestos redundant, not just because politicians lie and make promises that they just cannot keep with a long list of excuses ready as to why they could not fulfill their promises, but that post election parties will negotiate the actual programme for government as part of a coalition agreement. So today's Labour and tomorrows Conservative Manifestos are approximately 50% BS fantasy election bribes. Hung Parliament Seats Calculations The opinion polls currently forecast seat averages for Conservatives on 274.5 and Labour on 276.5. The calculations for what form a coalition government could take become extremely complicated if not impossible without resorting to a truly messy and disastrous outcome that involves the Scottish Nationalists i.e. Conservatives + Lib Dems (24.5) = 299 - FAIL Add DUP 8 seats = 307 - FAIL Whilst Labour + Lib Dems (24.5) = 301 - FAIL Which means the ONLY viable / workable outcome is one that involves the SNP i.e. Labour + SNP (49) =325 - SUCCESS, with perhaps the Lib Dems deciding to tag along for the limousine rides. The following are individual forecaster trends and my analysis.
Keeps flip flopping between Labour and Conservative in the lead and no greater distance than 10 seats from 275.
Have consistently exhibited a strong bias towards Labour which has been slowly eroding over time that suggest will converge with other forecasters over the next few weeks.
Tends to consistently put the Conservatives in a clear seats lead, so tends to most closely reflect my own long standing forecast.
After maintaining a continuous marginal advantage to the Conservatives over Labour has now swung in Labours favour, exhibiting no clear trend direction. Seats Forecast Trend Analysis
Overall the opinion pollsters are currently trending in favour of the Labour party which if the trend continues implies that Labour will be the largest party on election day on about 290 seats that is contrary to my forecast expectations for the Tories to lead with at least 296 seats. Another point of difference is that pollsters continue to grossly over estimate the number of seats the SNP will win i.e. typically 48-54, against my expectations of just 35. Conclusion In my judgement the opinion polls remain wrong as they continue to persistently under estimate the number of seats the Conservatives will actually win by a widening margin, who in my opinion could still even win an outright majority on May 7th. UK General Election Forecast 2015 In terms of what I actually see as the most probable outcome for the general election, I refer to my in-depth analysis of 28th Feb:
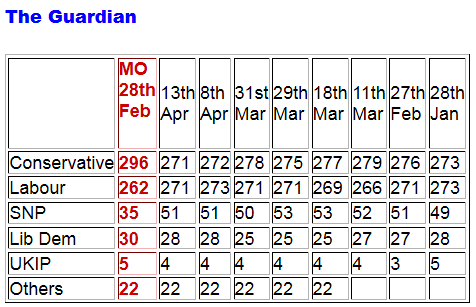
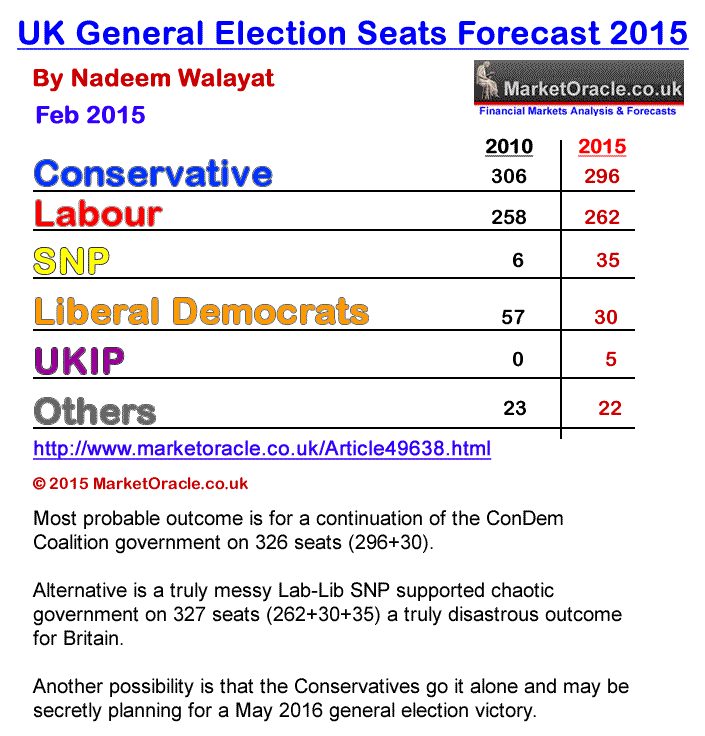
UK General Election May 2015 Forecast Conclusion My forecast conclusion is for the Conservatives to win 296 seats at the May 7th general election, Labour 2nd on 262 seats, with the full seats per political party breakdown as follows:
Therefore the most probable outcome is for a continuation of the ConDem Coalition government on 326 seats (296+30) where any shortfall would likely find support from the DUP's 8 seats. The alternative is for a truly messy Lab-Lib SNP supported chaotic government on 327 seats (262+30+35) which in my opinion would be a truly disastrous outcome for Britain, nearly as bad as if Scotland had voted for independence last September. Another possibility is that should the Conservatives do better than forecast i.e. secure over 300 seats but still fail to win an overall majority, then they may chose to go it alone with the plan to work towards winning a May 2016 general election. The bottom line is that the opinion polls do not reflect how people will actually vote on May 7th when they are faced with a stark choice of steady as she goes ConDem government or take a huge gamble on Ed Milliband's Labour party. So in my opinion several millions of voters will chose to play it safe with ConDem which thus is the most probable outcome. Also available a youtube video version of my forecast:
The opinion polls suggest that the UK is going to take a gamble on a Labour SNP government which my analysis has consistently warned will be a losing bet for Britain (SNP Labour Death Embrace). However, as is often the case that the opinion polls can be wrong, just as the Scottish referendum reality was never the 50/50 proposition that opinion polls suggested at the time (45/55), and so today's marginal advantage to a Labour SNP Alliance should at least resolve in a continuation of the Conservative / Lib Dem Coalition. Though the Conservatives may try to go it alone with the objective of a second better engineered election outcome within the next 12 months as the economy continues to grow above trend. The bottom line is that no matter which major party forms the next government, it will only make a marginal difference to the trend in UK house prices for the fundamental mega-trend drivers of population growth and lack of new house building. Therefore in terms of house prices, the difference between a Labour and Conservative led government will be approx 1-2% per year. Of course this trend is unsustainable as it becomes increasingly impossible for even well paid workers to climb onto the housing ladder, and even worse for the low paid where for instance if the Conservatives win will see even less social housing as existing tenants will refuse to budge as they see their housing association rental property in terms of the £77k to £103k potential pot of gold that they hope to someday, somehow capitalise upon, which if they do so ultimately means approx 40% of which will be sold onto the private rental sector. Thus as I stated earlier that Britain's housing crisis is storing up the potential for a huge deal of social unrest because as much as 1/5th of the UK population may be locked out of the UK housing market in the private rental sector, which implies that under political pressure from such a large number of potential voters that in the lead up to the 2020 General Election political parties may announce what is unthinkable today that is for a catastrophe for buy to let investors as the right to buy scheme is extended once more to the private rental sector that would result in a panic exodus at least at the bottom end of the UK housing market. Ensure you are subscribed to my always free newsletter for in-depth analysis and detailed trend forecast delivered to your email in box. Source and Comments: http://www.marketoracle.co.uk/Article50256.html By Nadeem Walayat Copyright © 2005-2015 Marketoracle.co.uk (Market Oracle Ltd). All rights reserved. Nadeem Walayat has over 25 years experience of trading derivatives, portfolio management and analysing the financial markets, including one of few who both anticipated and Beat the 1987 Crash. Nadeem's forward looking analysis focuses on UK inflation, economy, interest rates and housing market. He is the author of five ebook's in the The Inflation Mega-Trend and Stocks Stealth Bull Market series that can be downloaded for Free.
Disclaimer: The above is a matter of opinion provided for general information purposes only and is not intended as investment advice. Information and analysis above are derived from sources and utilising methods believed to be reliable, but we cannot accept responsibility for any trading losses you may incur as a result of this analysis. Individuals should consult with their personal financial advisors before engaging in any trading activities.
You're receiving this Email because you've registered with our website. How to Subscribe Click here to register and get our FREE Newsletter To access the Newsletter archive this link Forward a Message to Someone [FORWARD] To update your preferences [PREFERENCES] How to Unsubscribe - [UNSUBSCRIBE]
The Market Oracle is a FREE Financial Markets Forecasting & Analysis Newsletter and online publication. |
||||||||||||||||


© 2005-2022 http://www.MarketOracle.co.uk - The Market Oracle is a FREE Daily Financial Markets Analysis & Forecasting online publication.