


Stock Market Last Hurrah?
Stock-Markets / Stock Markets 2015 May 04, 2015 - 03:20 PM GMTBy: Andre_Gratian

 Current Position of the Market
SPX: Long-term trend - The bull market is still intact.
Intermediate trend - Is the 7-yr cycle sketching an important top?
Analysis of the short-term trend is done on a daily basis with the help of hourly charts. They are important adjuncts to the analysis of daily and weekly charts which ultimately indicate the course of longer market trends.
THE LAST HURRAH???
Market Overview
Last week's SPX high of 2125 stands a good chance of being the peak of the rounding top - a level which may not be exceeded for a long time. At least, not until we first experience a substantial correction that has the potential of creating a decline of between 400 to 450 points, at a minimum.
I know that it sounds like a lot, but it would only approximate a 50% correction of the index's uptrend since October 2011. That also happens to correspond to a minimum P&F count of the distribution pattern that has been formed since the October 2014 low.
This will only be authenticated by future market action, but everything finally seems to be in place from a technical point of view for the long-awaited correction to start. If this is truly a rounding top, don't expect prolonged weakness to start right away. For a while, we may only create a pattern of limited declines and rallies with a downward slant which will eventually accelerate and conclude in a climactic bottom. When will that be? Whenever the 7-year cycle bottoms several months from now.
The battle lines appear to have been drawn between the former high and the 2040 level. Breaking below 2072 should be the first sign that the proposed scenario is beginning to materialize.
Indicators Survey
The weekly momentum indicators were rescued from extending their decline by Friday's sharp rally but both the daily MACD and SRSI were left in a bearish configuration, as well as the A/D oscillator, in spite of that rally.
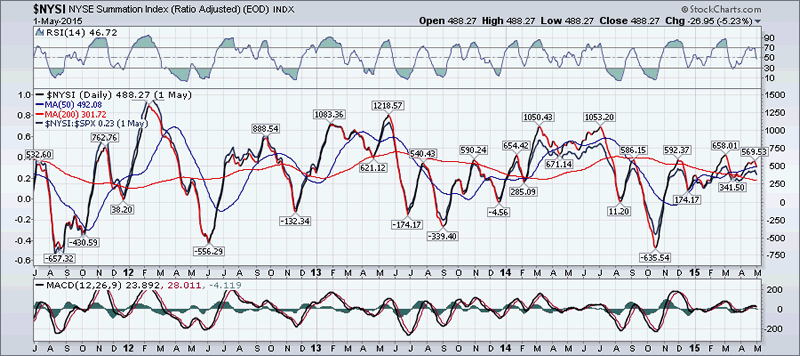
The Summation Index (chart below courtesy of StockChart.com) turned down last week after diverging sharply from the March peak when SPX made a marginal new high. Both the RSI and MACD have also turned down after exhibiting the same kind of negative divergence. This is a bearish pattern which will worsen if the NYSI drops below its former short-term low of 341.
SPX was kind enough to fulfill the 1X Point & Figure projection which was stated in last week's letter. This was followed by a 47 point decline which ended with a bounce on Friday. If the market resumes its downtrend this week with a decline below 2072, I will feel confident the scenario discussed above has started to prove correct.
The 3X price chart may have had its last rally from the trend line drawn from the October low.
Chart Analysis
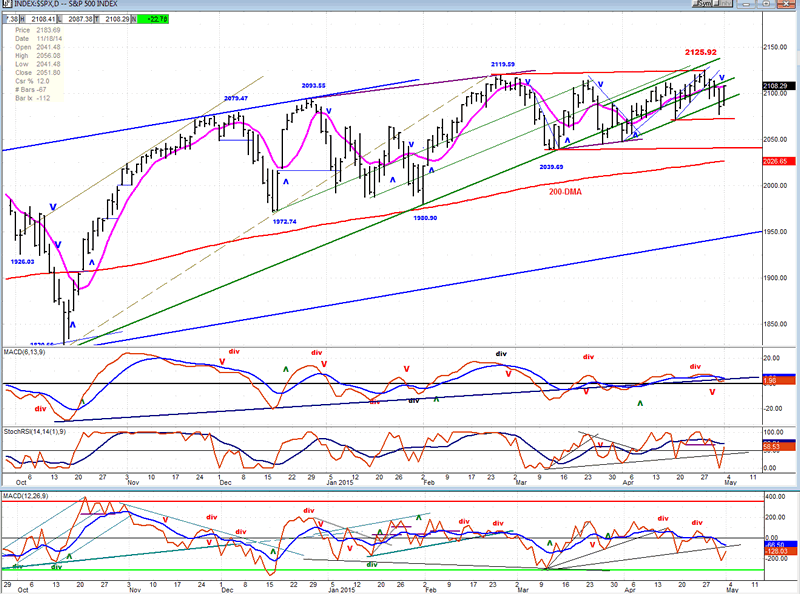
Let's start with our analysis of the daily chart of the SPX (courtesy of QCharts.com, as well as others below).
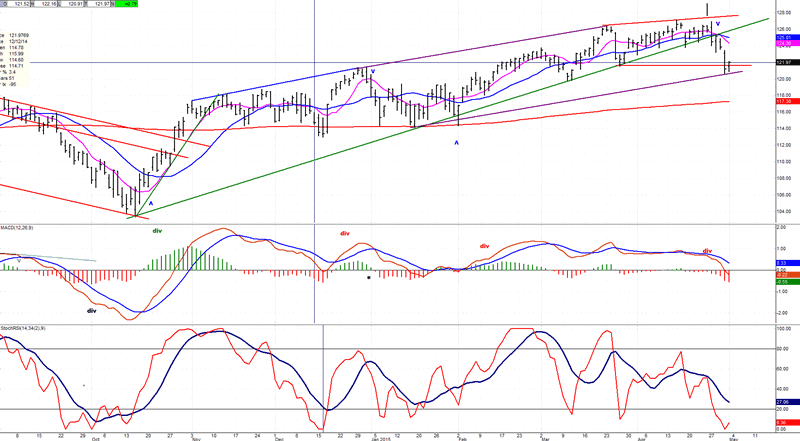
The (green) trend line from the October low was first tested in early March and has held. On the next three subsequent lows, it was slightly breached, but the index was able to work its way back above it each time. The third time even brought about a marginal new high about 6 points above the February high before the trend line was broken once again, this time taking prices a little deeper. Friday's rally stopped short by three points of going back above the trend line. If the rally from Thursday's low fails to do so and the index declines below 2073 with a follow through beyond the 2039 level, this will just about confirm that an intermediate decline has started.
On the Summation Index chart (above), I previously pointed out that a significant deceleration pattern had formed since the high that was made right after the October 2011 low. This has gotten worse since the October 2014 low and, we may finally be witnessing the final warning in the form of negative divergence in the NYSI vs. the 2125 SPX high.
The daily indicators are also in a downtrend and they would require substantial short-term market strength to improve their patterns. This is why next week will be a time to keep a close eye on the price and A/D performance.
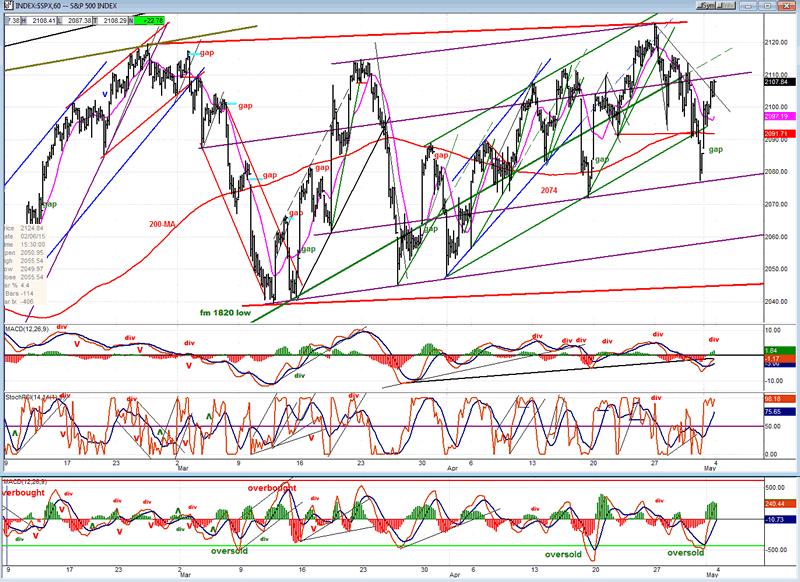
On the hourly chart, Friday's rally started after the index found some support on a parallel to the line connecting the last two short-term tops. It then found resistance on another parallel which is closer to the top line. Note that these parallels are not drawn arbitrarily. Several points where price stopped either on the way up or down align themselves perfectly on each parallel. If SPX cannot rise above the top parallel on Monday, odds will begin to favor a continuation of the decline.
All three oscillators appear ready to reverse. This would come at a time when the daily indicators are already in a downtrend, when the Summation Index and its indicators have already reversed, and when the SPX weekly momentum oscillators are also ready to turn down at the least provocation! In other words, all the indicators of the various time frames appear to be on the verge of making a synchronized move to the downside. If this happens, it would add greatly to the already bearish picture.
"The following indexes have proven themselves to be market leaders. Since the market appears to be at an inflection point, they should be carefully followed for potential signs of further deterioration."
Of the four that I posted last week, two showed visible deterioration: TRAN and IWM
TRAN
TRAN, which had rallied from the bottom of the declining channel almost retraced its rally entirely and it did not have that much of a bounce on Friday. Since this could merely be a retest of the low, let's see what happens next week.
IWM
IWM probably performed as poorly as any index when it dropped from a point very close to its high, finding support at the bottom of the purple channel. This was its weakest decline since January and its rebound also left a lot to be desired. It will need some close scrutiny next week!
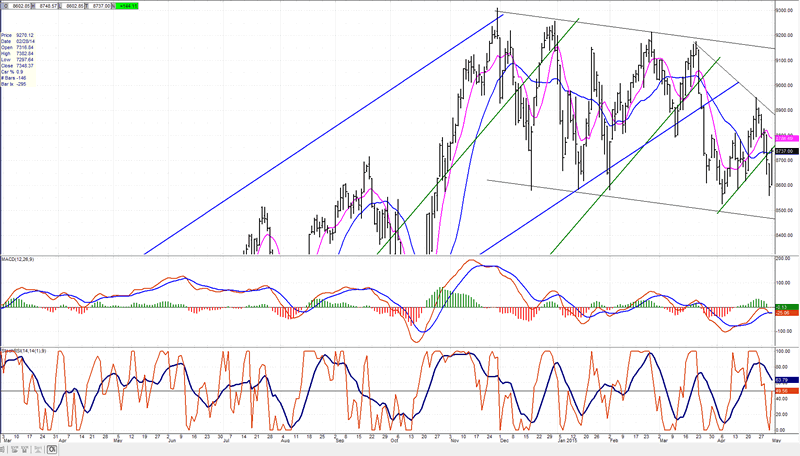
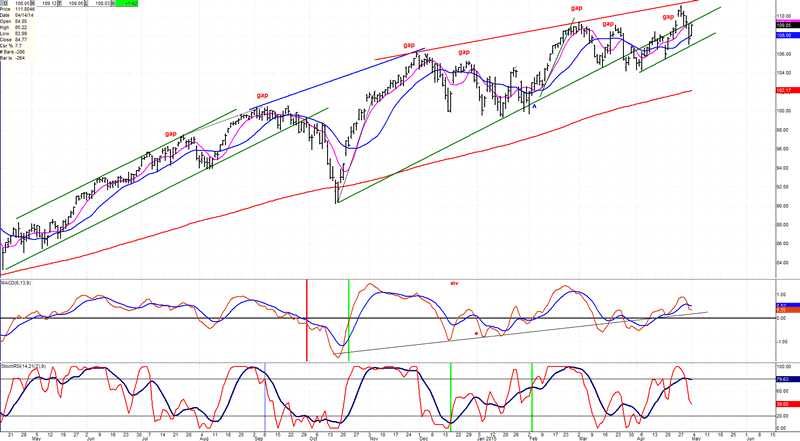
QQQ
QQQ, which is based on the NDX (recently the strongest component of the stock market), is shown here because it was mentioned in the Market Overview last week for having made what was thought to have been an exhaustion gap. So far, that appears to be the case. Note that for the past two years, every time the index had an exhaustion gap, it was followed by a decline, the worst one being last October. It is too early to foresee how much weakness will follow this time but, if it breaks below the line connecting the thee short bottoms, it could keep going for a while.
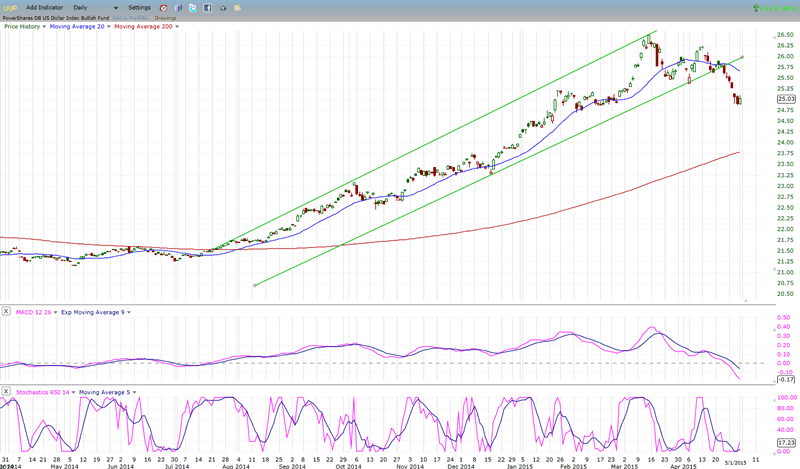
UUP
The dollar index continues to correct after its long and steady uptrend. Although it has higher P&F counts, these do not tell us when (or even if) these will be filled. The index has not done anything yet to suggest that this is more than a normal correction after a very strong rally.
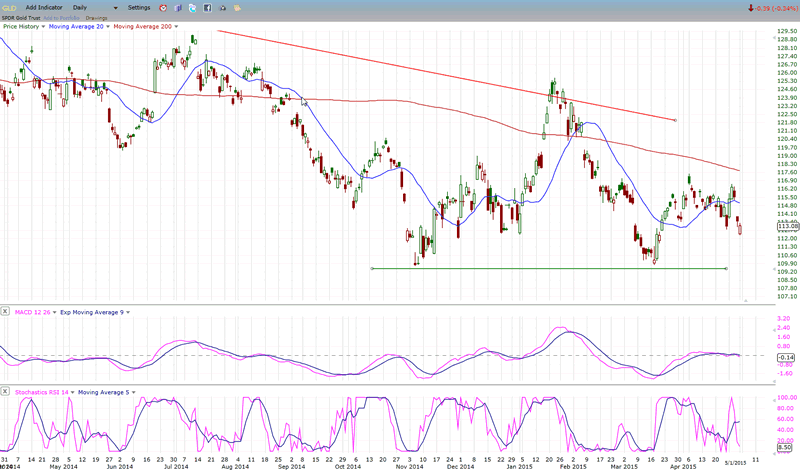
GLD
GLD is now in the time frame when its 25-week cycle should make its low. How much of an impact this will have on the price of gold is questionable since this cycle will be over-ridden by larger ones which are not due to bottom until late June.
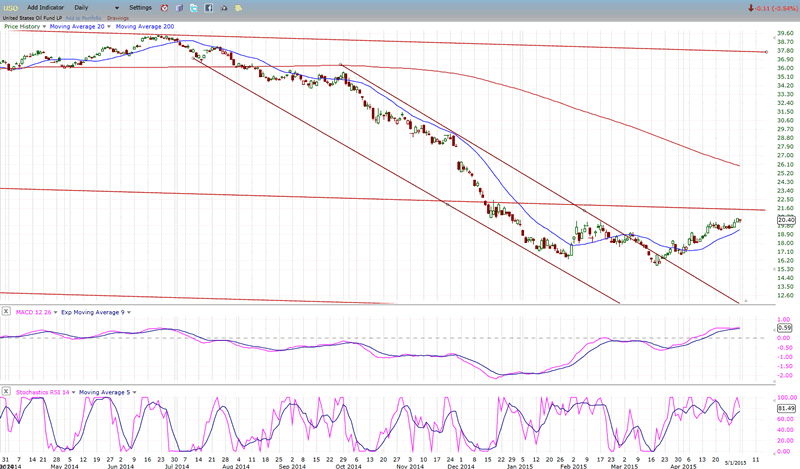
USO
The corrective move in the dollar is a reprieve for USO which is also in a corrective wave after its strong decline. The index could make a little more headway before seeking a more lasting low in the vicinity of its price projection.
Summary
The technical condition of the SPX strongly suggests that it is ready to start a correction of intermediate proportion. A decisive price decline below 2073 would be the first inkling that this is taking place, especially if it is followed by a move below 2039. Further deterioration in some key indicators such as IWM, TRAN, QQQ, etc... will also be necessary.
There have been many false starts which were followed by rallies to new highs. Some EW analysts hold on to the belief that we are undergoing a lengthy consolidation which will lead to the index soaring up to much more lofty heights!
As always, the market will have the final say in what IT wants to do!
FREE TRIAL SUBSCRIPTION
If precision in market timing for all time framesis something that you find important, you should
Consider taking a trial subscription to my service. It is free, and you will have four weeks to evaluate its worth. It embodies many years of research with the eventual goal of understanding as perfectly as possible how the market functions. I believe that I have achieved this goal.
For a FREE 4-week trial, Send an email to: info@marketurningpoints.com
For further subscription options, payment plans, and for important general information, I encourage
you to visit my website at www.marketurningpoints.com. It contains summaries of my background, my
investment and trading strategies, and my unique method of intra-day communication with
subscribers. I have also started an archive of former newsletters so that you can not only evaluate past performance, but also be aware of the increasing accuracy of forecasts.
Disclaimer - The above comments about the financial markets are based purely on what I consider to be sound technical analysis principles uncompromised by fundamental considerations. They represent my own opinion and are not meant to be construed as trading or investment advice, but are offered as an analytical point of view which might be of interest to those who follow stock market cycles and technical analysis.
Andre Gratian Archive |
© 2005-2022 http://www.MarketOracle.co.uk - The Market Oracle is a FREE Daily Financial Markets Analysis & Forecasting online publication.