


The Energy Complex: Very Interesting Chartology
Commodities / Energy Resources May 04, 2015 - 10:40 AM GMT

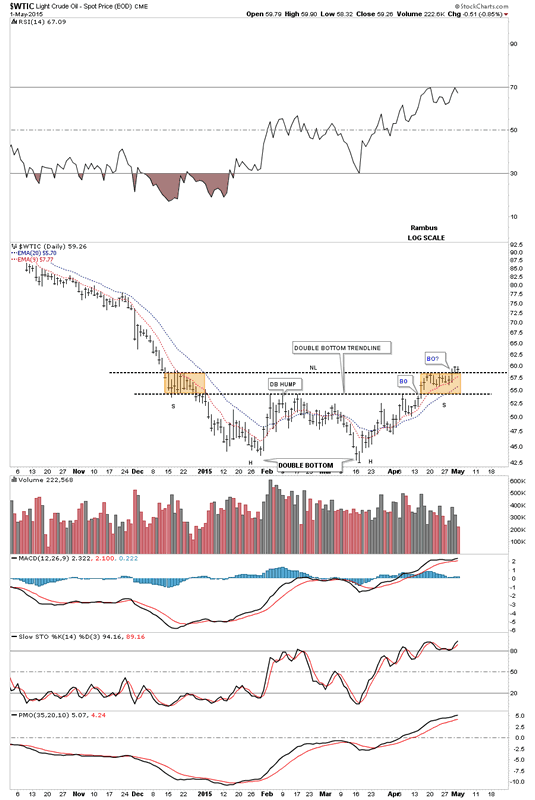
 Lets start by looking at the daily chart for WTIC I posted earlier this week that showed a potential inverse H&S bottom with a double bottom head. The brown shaded areas shows the left and right shoulders. WTIC has closed two days in a row above the neckline. So far so good.
Light Crude Oil Daily Chart
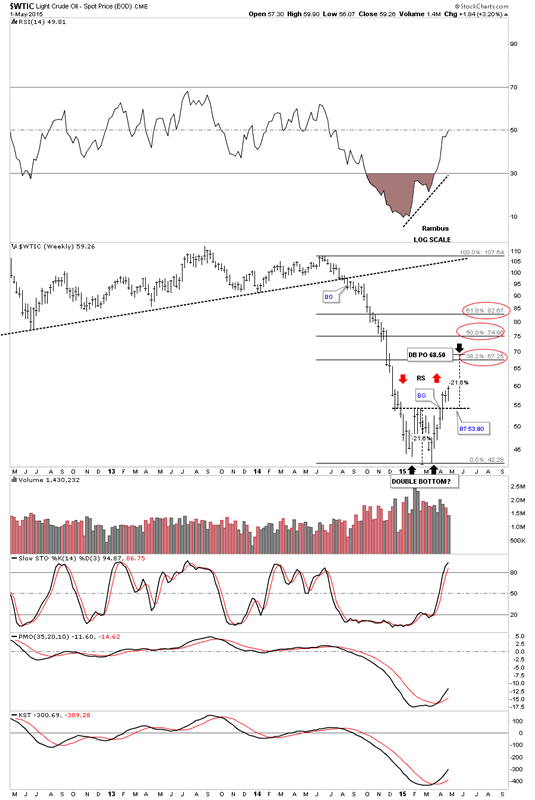
The weekly chart shows the double bottom with the fib retracements. The double bottom has a price objective up to the 68.50 area which is pretty close to the 38% retracement of the parabolic decline. When you have a straight line decline like oil had one would expect to see some reverse symmetry back up once a bottom is in place. The red arrows the reverse symmetry taking place right now to the upside. As this is a weekly chart it will be interesting to see what next weeks bar will look like as the weekly bar coming down was pretty long in this general area.
Light Crude Oil Weekly Chart
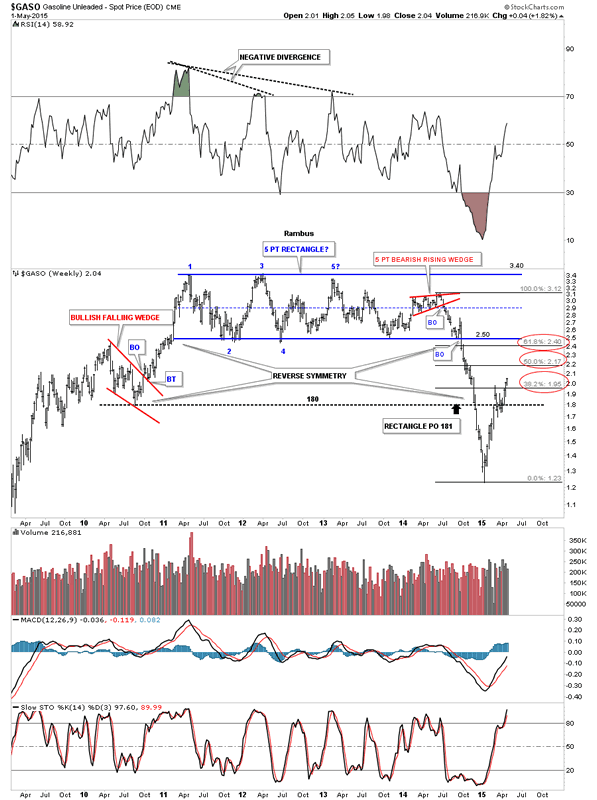
When we first opened our doors at Rambus Chartology I used to show this weekly chart for GASO on Friday nights. As you can see the big trading range ended up being a 5 point rectangle reversal pattern to the downside. Note the last little bump of the bottom rail just before the bottom fell out at 2.50. That last little touch of the bottom rail looked like another reversal to the upside but the bulls ran out of gas. The bears wasted little time in gaining control of the new move down. The rally in 2011 was pretty steep so when the price action broke down it was a good place to look for reverse symmetry. I originally was looking for initial support to come in around the 1.80 area which was the 2010 low but the bears had other plans and took GASO another magnitude lower before finally bottoming out at 1.23. GASO has made a V bottom and has already captured the fib 38% retrace at 1.95.
Unleaded Gas Weekly Chart
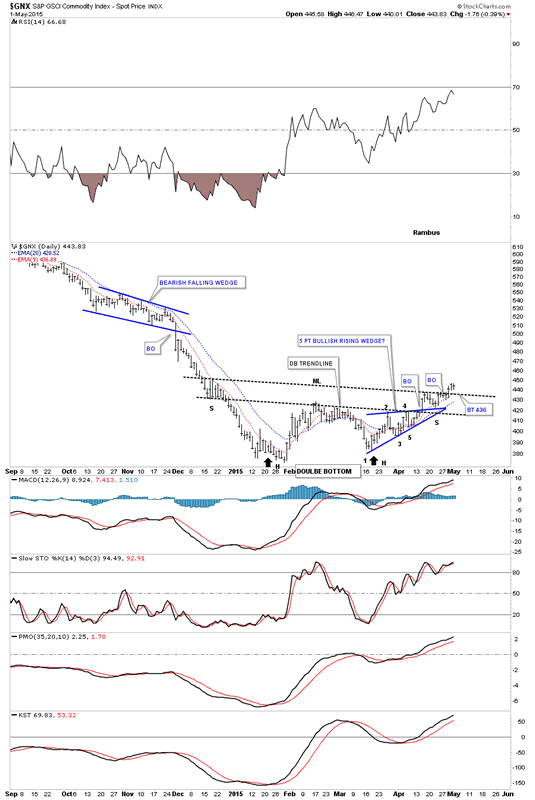
The GNX commodities index looks a lot like the daily chart for WTIC which is showing a double bottom head of a bigger inverse H&S bottom. WTIC’s neckline was horizontal while the GNX’s necklines slopes down a little bit. The price action has now closed 3 days in a row above the neckline. A backtest would come in around the 436 area.
GSCI Commodity Index Daily Chart
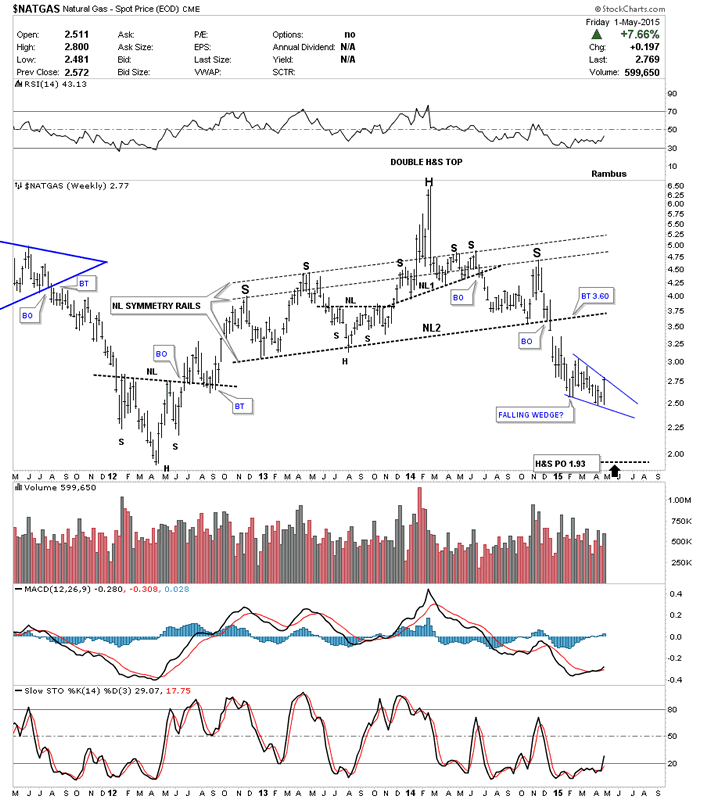
Lets look at one last chart for tonight which is the weekly look at Natural Gas which had a pretty good week to the upside. Originally I was showing the current consolidation area as a blue triangle. This weeks price action negated the blue triangle which maybe morphing into a falling wedge formation. As you can see Natural Gas closed right on the potential top rail. Any further strength will negate the blue falling wedge and it will be back to the drawing board. The reason why I think this could be a bearish falling wedge is because it’s forming between the neckline of the massive H&S top and the H&S top’s price objective that goes all the way down to 1.93 or so. Next weeks price action will be very interesting to say the least. All the best...Rambus
Natural Gas Weekly Chart
All the best
Gary (for Rambus Chartology)
FREE TRIAL - http://rambus1.com/?page_id=10
© 2015 Copyright Rambus- All Rights Reserved
Disclaimer: The above is a matter of opinion provided for general information purposes only and is not intended as investment advice. Information and analysis above are derived from sources and utilising methods believed to be reliable, but we cannot accept responsibility for any losses you may incur as a result of this analysis. Individuals should consult with their personal financial advisors.
© 2005-2022 http://www.MarketOracle.co.uk - The Market Oracle is a FREE Daily Financial Markets Analysis & Forecasting online publication.