


This Financial “Seismograph” Signals A Monetary Earthquake
Stock-Markets / Financial Markets 2015 May 04, 2015 - 07:49 AM GMTBy: GoldSilverWorlds

 Stock markets in the U.S. are trading approximately 2% from their all-time highs, the German DAX has slightly retraced from its all-time highs, the Nikkei index in Japan has almost surpassed its 2000 highs in recent days, the Shanghai stock index used to be a laggard but is making up at an incredible pace (currently trading at 7-year highs). Indeed, it feels like nothing can go wrong.
We are not yet in bubble territory, and the market is not setting up for an implosion as it did in December 1999 or July 2008. However, we are in the midst of a monetary bubble, driven by an explosion of the monetary base and an implosion of interest rates. Paper assets, as opposed to hard assets, have been pumped up by the liquidity that is being funneled into the economic system and the markets.
But exactly that perception that nothing can go wrong is so dangerous. The number of divergences in the system is becoming mind-boggling, a red flag for secular investors.
Economic activity is not reflecting the performance of the stock market at all, or vice versa. The headline figures all seem to tell a recovery story, like consumer confidence which is back at pre-crisis levels, or the unemployment rate, which is seemingly ok. Nothing new so far.
However, deepdiving into the world of economic data proves otherwise. Case in point: close to 50 economic data points which are highlighted in this “chartfest” learn how shaky the recovery is. We have chosen three charts to justify our point of view.
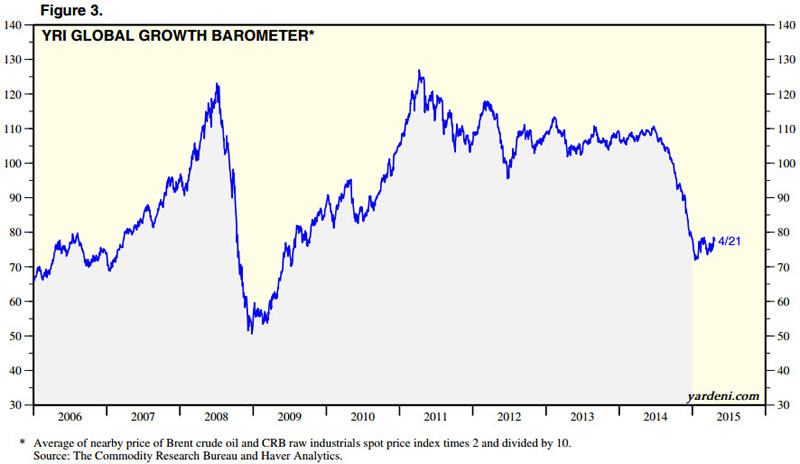
The global growth barometer has collapsed in 2014. It was undoubtedly driven by the oil market collapse. Low commodity prices are no sign of economic health.
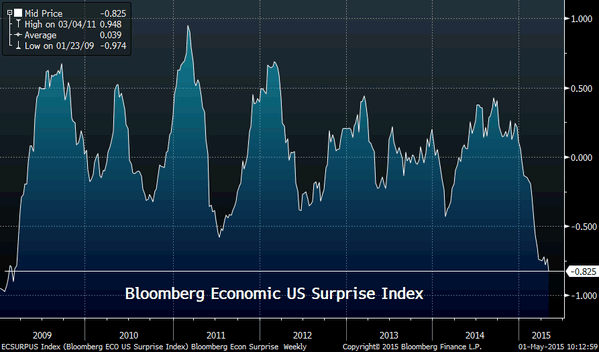
Potentially more concerning is the economic surprise index by Citigroup reflecting the direction and level of economic surprises. If it rises, it means that economic data are on average better than expected (positive surprise). Currently, it shows a negative reading similar to the depths of the 2009 crisis. (H/T: Charlie Bilello, CMT, ;@MktOutperform)
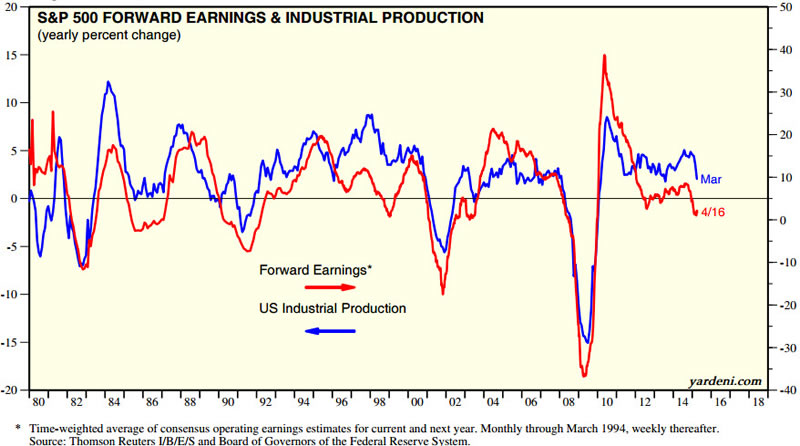
One example of a negative surpise is the profit cycle in the U.S. The indicator used for the profit cycle is the forward earnings of S&P 500 companies (red line in below chart). Forward earnings are highly correlated with industrial production, and both are clearly in decline since 2011. That is playing out while the U.S. stock market is reaching one all-time high after another.
So far, these divergences have not resulted in a meaningful correction of stock and bond markets. Mainstream investors have gotten at the point of “acceptance of the new normal.” And rightfully so, because why worry if markets are climbing higher, indicating that everything has to be ok?
The acceptance of the new normal is the most worrisome fact for investors.
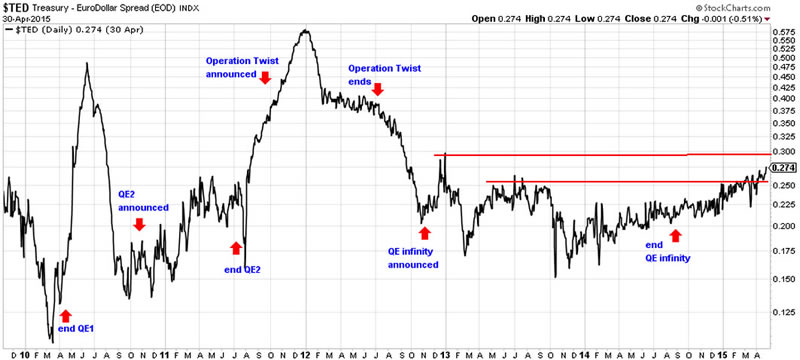
And that is exactly the time when things mostly take an “unexpected” turn. One of the most reliable indicators of stress in the financial system is the TED-spread. It should be considered as a “seismograph.” It telegraphs that something is brewing under the hood. Its long-term chart below shows that there were plenty of signals in 2007/2008 that telegraphed a significant correction.
Although the TED-spread has not generated any extreme readings, a clear rising pattern is unfolding, as evidenced by the five-year chart. Note that the rise started a bit after QE3 ended (in our words: QE infinity). The TED-spread has broken through a first resistance point (lowest red line) and is approaching a second one dating back to the end of 2012. That does not bode well.
The uptrend in the TED-spread is visible on the next chart, showing the rate of change in purple. Clearly, the “strength” of the rise is the strongest in two years.
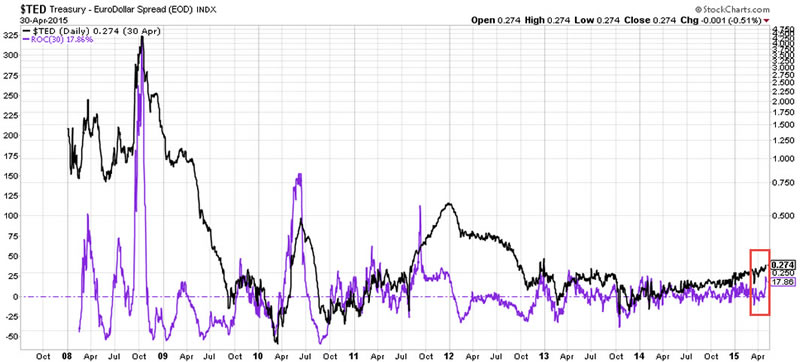
Is a correction in the markets brewing? There is definitely a fair chance, in particular if the TED-spread keeps edging higher.
But what if this turns out to be more than just a correction? With interest rates heading into negative territory, and with a monetary base that has exploded since massive monetary stimulus started in 2009, what are central planners going to do when the next severe correction or even crisis hits? Or, even worse, what if they inadvertently induce a new crisis as a result of their decisions?
Obviously nobody has a clear answer to that question. There is no way for central planners to know how things will play out as there simply is no empircal evidence whatsoever. There are a lot of assumptions and opinions, but who cares about these? At the end of the day, your personal wealth is at risk.
Secular investors, in our view, protect themselves with hard assets. Just because hard assets are out of fashion, it is a right time to consider them. That does not mean that investors should go ‘all the way.’ The point is that there will be a time when hard assets provide the protection they have always provided in history.
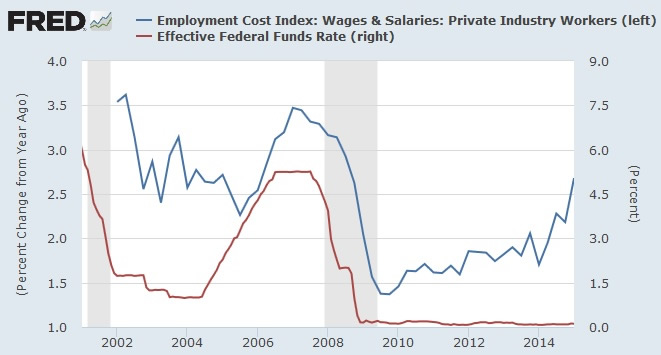
Here is one scenario that could be playing out right here right now: a weakening economy with rising inflation. Impossible? Everyone thought so in the 70ies. But “stagflation” could be back, and we would urge you to not judge until you have read the following two facts.
The chart below shows wages and salaries growth compared to interest rates. Janet Yellen has expressed several times the importance of wage growth; it appears to be one of her favorite ways to achieve the desired 2% inflation target. According to the chart, wages have risen from below 1.5% at the beginning of 2014 to 2.5% today. Higher wages imply more spending.
On top of rising wages, inflation expectations are stubbornly refusing to go lower. In other words, the market continues to anticipate inflation. That is evidenced by TIPS, as recently explained and shown in “What Is Really Driving Gold.” Inflation expectations have been on the rise since last year, and are on the cusp of breaking out. Gold is not anticipating that trend yet; from the moment it does, we would have the ultimate confirmation of rising inflation.
For the pundits that are cheerfully praising the highs in the stock market, it should be noted that, when put into perspective, stocks remain well below gold's quadruple rise since 1999.
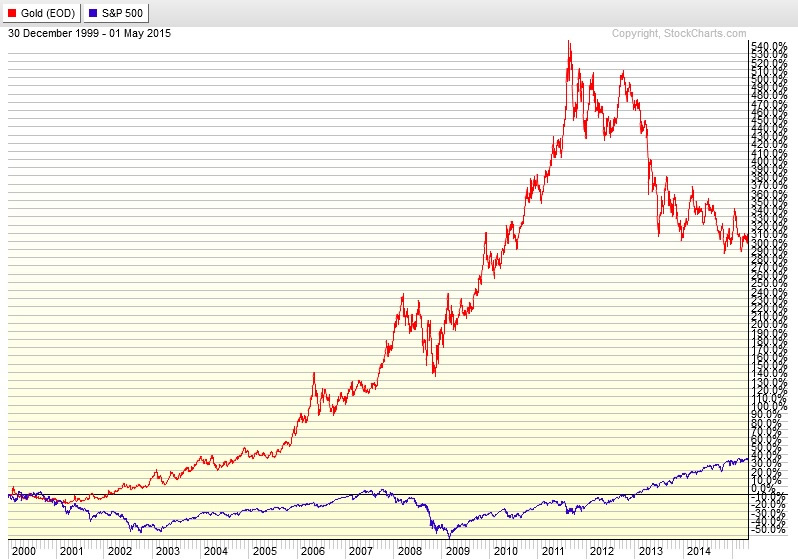
If inflation goes higher, and we believe that eventually it will, people will flock to gold and gold-related assets. In such an environment, which asset would you trust most: government backed assets or hard assets?
Secular Investor offers a fresh look at investing. We analyze long lasting cycles, coupled with a collection of strategic investments and concrete tips for different types of assets. The methods and strategies are transformed into the Gold & Silver Report and the Commodity Report.
Follow us on Facebook ;@SecularInvestor [NEW] and Twitter ;@SecularInvest
Source - http://goldsilverworlds.com
© 2015 Copyright goldsilverworlds - All Rights Reserved Disclaimer: The above is a matter of opinion provided for general information purposes only and is not intended as investment advice. Information and analysis above are derived from sources and utilising methods believed to be reliable, but we cannot accept responsibility for any losses you may incur as a result of this analysis. Individuals should consult with their personal financial advisors.
© 2005-2022 http://www.MarketOracle.co.uk - The Market Oracle is a FREE Daily Financial Markets Analysis & Forecasting online publication.