


How One Chart Is Changing My Outlook on Crude Oil Prices
Commodities / Crude Oil May 01, 2015 - 07:30 AM GMTBy: Money_Morning

 Dr. Kent Moors writes: Today, something truly unique is underway – and you can see it clearly in the one simple chart I’m about to share.
The advent of huge shale and tight oil reserves in the U.S. has fundamentally altered the terrain of the international energy game.
We still call these reserves “unconventional” to distinguish them from traditional vertically drilled non-fracked wells. But due to the fact that most of the new production is coming from these rock-confined sources, they are certainly becoming mainstream.
This development has resulted in a knock-down, drawn-out war between OPEC and American shale, a matter I have occasionally discussed in Oil & Energy Investor.
The fight is over market share, and the oil cartel will feel even more pressure once Congress lifts the ban on U.S.-produced crude, as I believe is inevitable this year. We will then have a real global market battlefront.
Nonetheless, one matter is becoming clear. The traditional “call on OPEC” (where a monthly read of what the world’s demand requires in supply from the organization’s members) is rapidly being replaced by a “call on shale” in setting the price.
But here’s where things get really interesting…
Oil Pricing Dynamics Have Been Skewed
Take a look at this chart, which I recently shared at an industry briefing. I have never seen anything like this before.
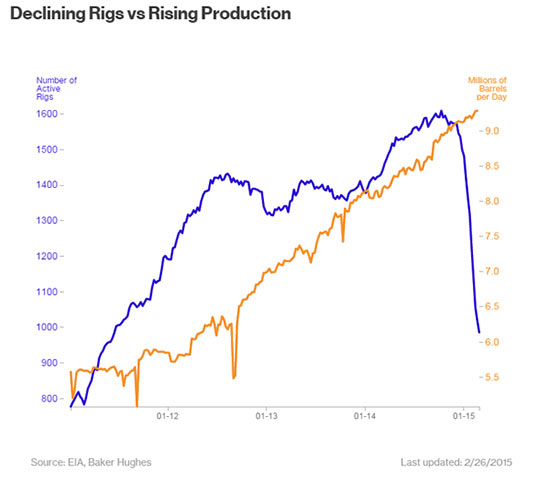
Despite significant cuts in company forward capital expenditure commitments for new projects and a historic withdrawal of rigs from the fields, production has continued to increase in the U.S.
The oversupply – both aboveground in storage and readily available below ground – means the supply side of the equation is no longer a concern. Aside from spot shortages because of unexpected market glitches, there is plenty of oil to meet any demand spike.
Normally, the broad relationship between supply and demand determines the price of oil (as with just about anything else). A low price discourages new investment in drilling, resulting in lower supply. A high price indicates insufficient supply to meet demand and results in a rise of investment, which then leads to more production.
But now the usual dynamics of determining price are skewed in a manner quite unlike anything the market has ever witnessed.
Oil Prices Are Steadily Climbing
We are in a period in which nothing short of a major geopolitical explosion could drive up prices quickly. Instead, a confluence of production restraints by the operators, drawdowns from storage, and increasing competition among sources will emerge as staples of the new supply-demand balance.
More immediately, there have been other factors prompting a rise in price. The most important has been the current decline in the value of the dollar versus the euro and – to a lesser extent – other currencies.
A higher dollar tends to depress oil prices. This is because the vast majority of oil sales globally are conducted in dollars. When the dollar rises, it costs more euros to buy oil but fewer dollars. That reduced both the price (in dollars) and the demand for it.
On the other hand, when the dollar is falling, the trade cost for the oil reflects more dollars and fewer euros. In this case, the opposite takes place: The price for a barrel of oil increases, as does the demand (now satisfied more cheaply in local currency elsewhere).
Then there is the almost paradoxical approach to surplus production. Previously, the Energy Information Administration (EIA) would announce a weekly rise in oil production, and the price would respond in the opposite direction. That had certainly been the case for months, as higher volume in storage had resulted in a restrain on crude prices.
But this week began seeing something else. The EIA once again reported a buildup of oil production. And while it was nearly 2 million barrels, it was less than analysts had expected.
Prices rose.
My Newest Predictions for Oil Prices
Expectations are changing. The support for slowly rising prices is being built in.
Don’t expect a frantic run to triple-digit-per-barrel prices. But I’ve got a revised estimate.
Previously, my estimate for West Texas Intermediate (WTI, the New York crude oil futures contract benchmark) had been $60-$65 and $70-$75. For Dated Brent (the London benchmark), I gave $70-$73 and $78-$82. Brent is the more widely used benchmark internationally and is more sensitive to international unrest (such as the Arab Spring II underway in the Middle East). It trades as a premium to WTI.
But now I am predicting that WTI should be $65-$68 per barrel by the end of July, and $73-$78 by the end of the year. Brent should come in at $75-$78 for July and $82-$85 by December 31.
Now, it is not necessary for these prices to rise quickly for us to make some nice money by investing in selected stocks. As I told my Energy Inner Circle members this morning, there are currently 27 stocks on my tracking and trigger lists that are up double digits for the month.
Oil’s trajectory is shaping up to be in a “ratcheting” pattern. This is the term I have used for years when referring to a pricing adjustment that is moving up overall but with intermittent declines and bouts with volatility.
Crude prices are rising, albeit along this restrained path. That’s fine with us. A stable rise is always a good way to make money.
Source :http://oilandenergyinvestor.com/2015/04/how-one-chart-is-changing-my-outlook-on-oil-prices/
Money Morning/The Money Map Report
©2015 Monument Street Publishing. All Rights Reserved. Protected by copyright laws of the United States and international treaties. Any reproduction, copying, or redistribution (electronic or otherwise, including on the world wide web), of content from this website, in whole or in part, is strictly prohibited without the express written permission of Monument Street Publishing. 105 West Monument Street, Baltimore MD 21201, Email: customerservice@moneymorning.com
Disclaimer: Nothing published by Money Morning should be considered personalized investment advice. Although our employees may answer your general customer service questions, they are not licensed under securities laws to address your particular investment situation. No communication by our employees to you should be deemed as personalized investent advice. We expressly forbid our writers from having a financial interest in any security recommended to our readers. All of our employees and agents must wait 24 hours after on-line publication, or after the mailing of printed-only publication prior to following an initial recommendation. Any investments recommended by Money Morning should be made only after consulting with your investment advisor and only after reviewing the prospectus or financial statements of the company.
Money Morning Archive |
© 2005-2022 http://www.MarketOracle.co.uk - The Market Oracle is a FREE Daily Financial Markets Analysis & Forecasting online publication.