


Society's Leaders Have Been Digging a Bottomless Economic Pit
Politics / Global Debt Crisis 2015 Apr 27, 2015 - 07:44 AM GMTBy: Brian_Bloom

 A friend sent me the link below, which seems extraordinarily relevant in context of the fact that I once calculated the value of the Chinese ghost cities at around $6.5 trillion. The article discusses the downward pressures on China’s economy.
http://www.zerohedge.com/news/2015-04-24/china-could-face-sharp-rise-capital-outflows-if-stocks-economy-lose-momentum
The chart below shows that China’s GDP was $9.24 trillion in 2013. https://www.google.com.au/#q=china%27sgdp (supposedly higher in 2014)
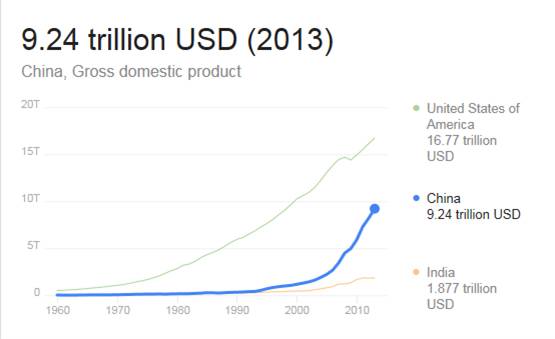
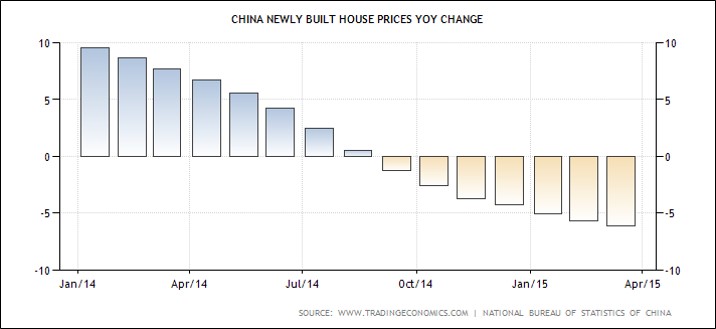
Assuming that these cities were built over a period of (say) ten years, and assuming that the Chinese GDP has averaged around $10 trillion p.a. since the GFC, it may have been that the building of these ghost cities is what accounted for most of China’s GDP growth since the GFC. (Very roughly: $6.5 trillion / 10 years = $650 billion a year. $650 billion divided by $10 trillion = 6.5%). In this context, and in context of Chinese belt tightening (and falling real estate prices – see chart below http://www.forbes.com/sites/mikepatton/2015/04/23/the-china-syndrome-is-china-headed-for-a-financial-meltdown/ ) – the “forecast” of 7% growth in GDP for this coming year is very probably garbage.
Will the global economic centre of gravity shift back to the US?
Although it is argued that the US economy has been growing, here is the reality:
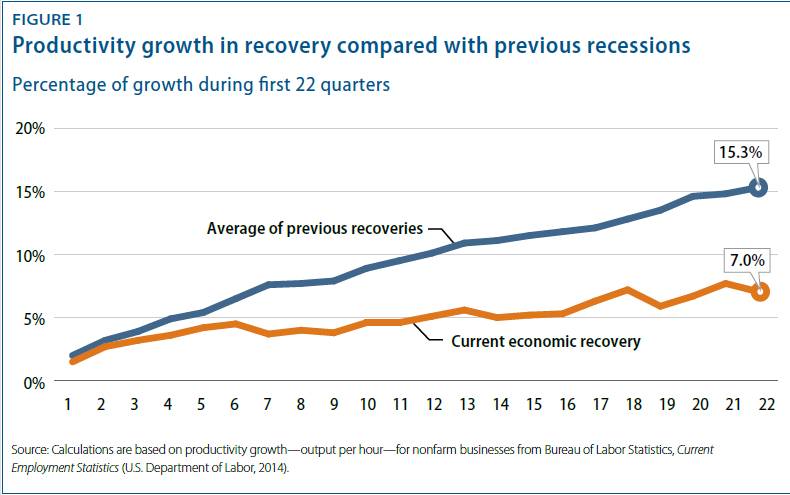
Labour productivity improvements have been lacklustre since the GFC “turnaround”. https://cdn.americanprogress.org/wp-content/uploads/2015/03/EconSnap_Mar2015.pdf
In addition, jobs created have also lagged behind historical post recession numbers – see chart below
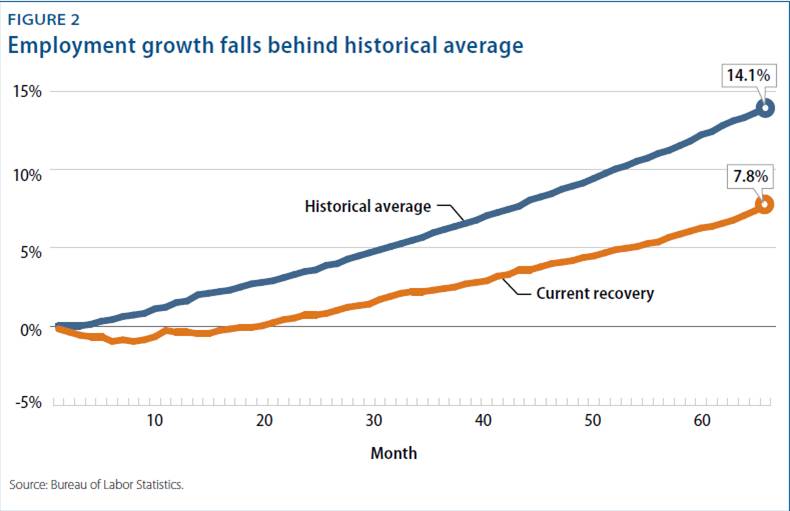
What this information implies is that Quantitative Easing cannot “buy” economic vibrancy. Despite QE, relatively fewer jobs have been created in the US (than which followed previous recessions) and, overall, productivity has remained relatively lacklustre.
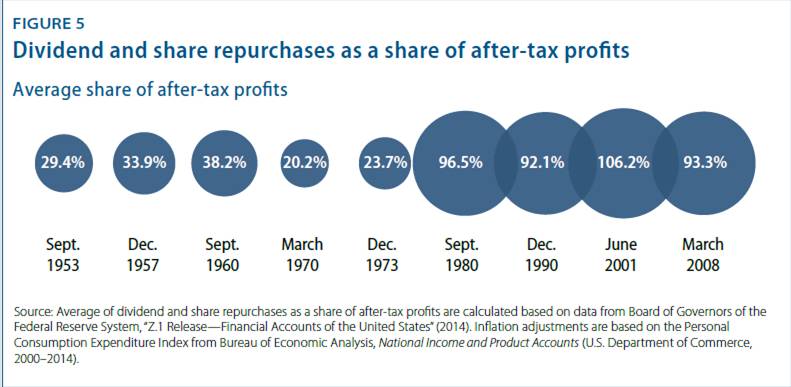
Finally, here is a really chilling chart (source: ibid). What it shows is that the booming stock markets since the 1980s may well have been driven largely by the fact that corporations have been spending almost 100% of their cash flow on dividends and share buybacks. When you have fewer shares in circulation then, even if your profits remain flat, your earnings per share will continue to rise. Clearly, if corporations are applying most of their cash to this activity then they will be spending less (financed via borrowings) on capital expenditure. Importantly, corporations in general have not been positioning for vibrant growth
So all this begs the question: What is going to “drive” US economic growth? A strong dollar will negatively impact exports which, in turn, will create a drag on the economy – even as the growing volumes of cash inside the US slosh around looking for a home. The QE dollars will have come home to roost. More share buybacks? Higher share prices and P/E ratios?
To my way of thinking the “key” financial indicator remains the S&P Global 1200 Industrials Chart below: https://www.google.com/finance?cid=10264130
Technically, it is hitting a long term “double top” but the short term patterns indicate the possibility of a break up which, in my view, would be false given the state of the global markets.
1. There is a rising right angled triangle – which is bullish
2. There is arguably, an inverted head and shoulders which, if broken, could see the Index rise by 150 points.
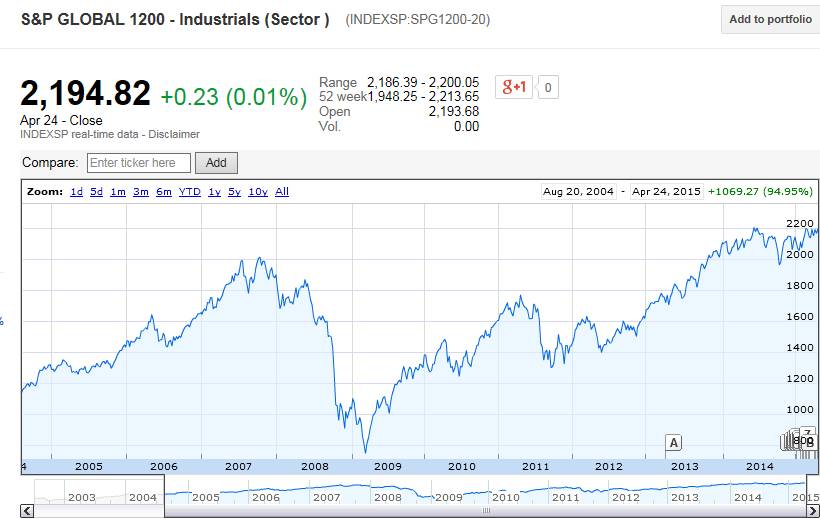
Despite the technical possibility of a break up, common sense needs to prevail. Why would the S&P 1200 break up in context of a stagnating global economy?
Well, Europe has “supposedly” turned the corner and the Indian economy is reputed to be doing okay.
Germany (a proxy for Europe?) seems to be doing okay – but we will know more on May 22nd . Q4’s buoyant numbers followed two quarters of lacklustre growth. https://www.economy.com/dismal/countries/IDEU The proximate cause of the German economy’s Q4 growth may have been as simple as a strong US dollar.
Key Economic Indicators for Germany
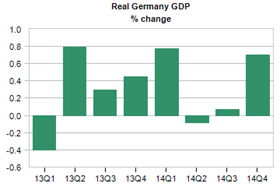
GDP
Latest: 0.7% for 2014Q4
Previous: 0.1% for 2014Q3
Next Release: May 22, 2015
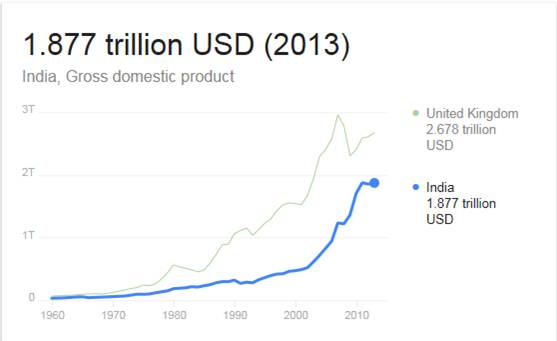
India’s economic indicators below. GDP growth has been good, but it has had a strongly negative trade balance
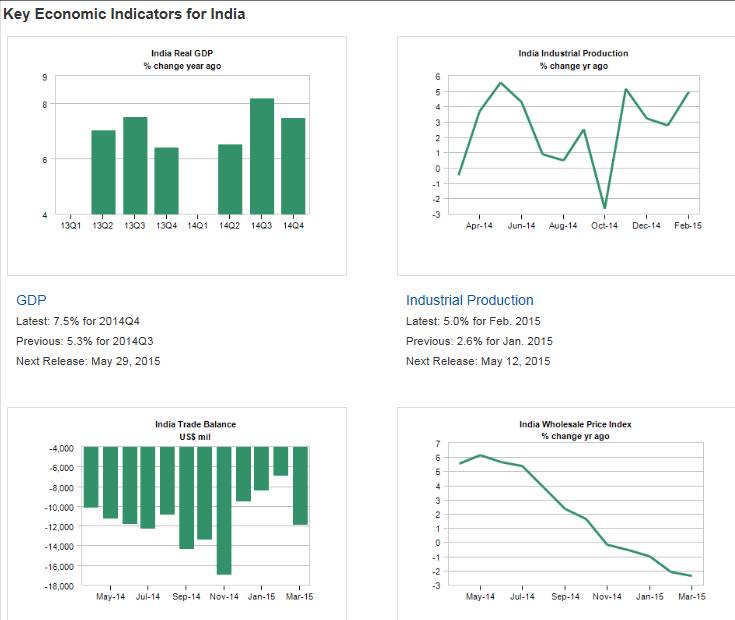
Once again, keeping our feet on the ground, India’s GDP is a small fraction of the that of either the US or China. https://www.google.com.au/#q=india%27s+gdp
Bottom line question:
If the S&P 1200 index breaks up, will this be a false break out or will it demonstrate optimism that the global economy is coming out of recession? Well let’s look at a summary of the facts:
Summary
The QE dollars are coming home to roost, and the US cannot “reasonably” continue with QE if dollars are flooding into the country from outside its borders because of the strong dollar. Weight of money might drive the stock market (and P/E ratios) upwards for a short while, but the strong dollar will act as a drag on the US economy which has been showing signs of stagnating via its productivity and employment numbers. China’s economy is faltering and, piercing through the veil of obfuscation, published statistics on China’s GDP growth have not represented the reality that most GDP growth since the GFC has been artificially created via ghost city construction activity. China’s economy is more likely to stagnate than to grow at the forecast 7%. Germany’s numbers appear robust but this might have been facilitated by high exports to high net worth consumers in the US because of the strong dollar. India is doing well but it’s GDP is around 3% of the global total.
Conclusion
Unless there is something significant brewing out of sight of the media the world’s stock markets are not representing the reality of what is happening in the world economy. The longer this disconnect continues, the more painful will be the outcome. This latest article on Greece shows just how desperate the policy makers are to continue kicking the can down the road: http://newsletters.briefs.blpprofessional.com/document/DBhnZjvcV09ptIPNgnGO2w--_4kz180qv1yrzb8h7ae
Overall Conclusion
Society’s leaders have lost the plot and their policies are making things worse, not better. Its past time for some outside-the-box thinking. The world’s central banks are part of the problem, they are not part of the solution.
Author, Beyond Neanderthal and The Last Finesse
Links to Amazon reader reviews of Brian Bloom’s fact-based novels:
Beyond Neanderthal and The Last Finesse are now available to purchase in e-book format, at under US$10 a copy, via almost 60 web based book retailers across the globe. In addition to Kindle, the entertaining, easy-to-read fact based adventure novels may also be downloaded on Kindle for PC, iPhone, iPod Touch, Blackberry, Nook, iPad and Adobe Digital Editions. Together, these two books offer a holistic right brain/left brain view of the current human condition, and of possibilities for a more positive future for humanity.
Copyright © 2015 Brian Bloom - All Rights Reserved
Disclaimer: The above is a matter of opinion provided for general information purposes only and is not intended as investment advice. Information and analysis above are derived from sources and utilising methods believed to be reliable, but we cannot accept responsibility for any losses you may incur as a result of this analysis. Individuals should consult with their personal financial advisors.
Brian Bloom Archive |
© 2005-2022 http://www.MarketOracle.co.uk - The Market Oracle is a FREE Daily Financial Markets Analysis & Forecasting online publication.