


Stock Market Correction May be Nearing End
Stock-Markets / Stock Markets 2015 Apr 18, 2015 - 04:11 PM GMTBy: Tony_Caldaro

 Another choppy week. The market started the week at SPX 2102, rallied to 2108 on Monday, dropped to 2083 on Tuesday, rallied to 2012 on Wednesday, then dropped to 2072 on Friday, before ending the week at 2081. For the week the SPX/DOW lost 1.15%, the NDX/NAZ lost 1.45%, and the DJ World index lost 0.30%. On the economic front reports again came in mostly to the upside. On the uptick: retail sales, the CPI/PPI, business inventories, the NAHB, housing starts, the Philly FED, consumer sentiment, leading indicators, the WLEI, and the monetary base. On the downtick: the NY FED, industrial production, capacity utilization, and weekly jobless claims rose. Next week we get three reports on housing and durable goods orders.
LONG TERM: bull market
While the SPX has spent the past four months effectively in a 2000 and 2100 trading range, there has been a plethora of counts being passing around. From ending diagonals, to leading diagonals, to Primary IV underway, triangles and flats. It is times like these that has nearly everyone guessing the next big move in the market. During this period we have maintained the same count: Major waves 3 and 4 completed by early-February, and either Minor 1 or Intermediate i ended in late-February at SPX 2120. We see no reason to change that view.
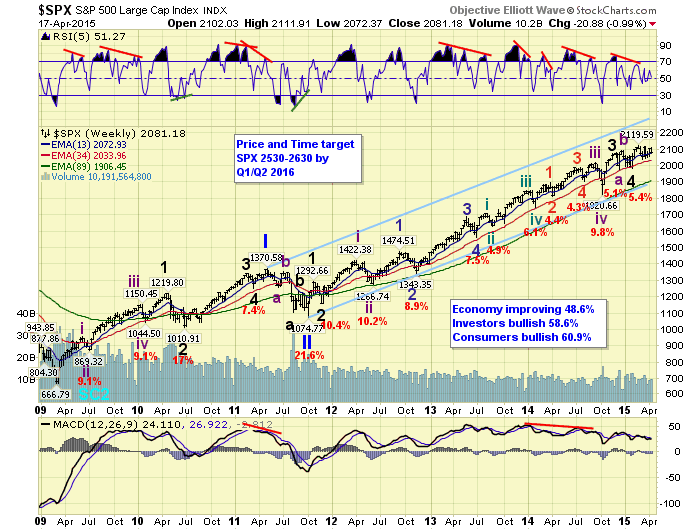
The Cycle wave [1] bull market of 2009 continues to unfold. Primary waves I and II, of this five primary wave bull market, ended in 2011. Primary wave III has been underway ever since. During Primary I Major wave 1 subdivided, and Major waves 3 and 5 were simple. During Primary III Major wave 1 was simple, and Major wave 3 subdivided. We continue to expect Major wave 5, which is underway now, to subdivide as well. When Primary III does conclude, which we expect in the year 2016, there will be a steep Primary IV correction and then new highs for Primary V by 2017.
MEDIUM TERM: uptrend under pressure
The current Minor 1/Intermediate i uptrend began in early February. By late February it had hit a high of SPX 2120. Since then the market has remained in a 75 point trading range for seven weeks. We have had a decline to SPX 2040, which we labeled Minute/Minor a, then a rally to SPX 2115, which we labeled Minute/Minor b. The Minor wave labels are on the chart below, and the Minute labels are posted on the hourly charts. After the SPX 2115 rally the market dropped to SPX 2046, bounced, dropped to SPX 2048, then rallied to SPX 2112 this week. If one compares the recent corrective activity from SPX 2120, and the activity during Major wave 4, you will notice they still look somewhat similar. In both cases there was a quick decline, a quick rally, and then some choppy sideways action until the correction ended. It appears this correction is now in its last leg down.
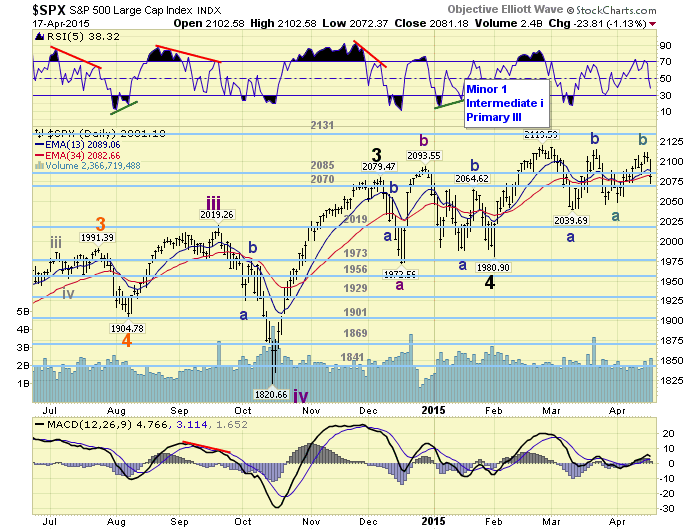
When this pullback/correction began in early March we calculated a few support levels based upon the wave structure of the uptrend and Fibonacci retracement levels. The wave structure suggested support between SPX 2042 and 2072, and Fibonacci support was at SPX 2051 (50% retracement) and SPX 2034 (61.8%). Thus far the low for this pullback/correction has been SPX 2040. More on this below. Medium term support is at the 2070 and 2019 pivots, with resistance at the 2085 and 2131 pivots.
SHORT TERM
While this pullback/correction has been quite choppy it has continued to unfold in abc’s. We have had an abc decline to SPX 2040, and abc rally to SPX 2115, what could be an abc decline to SPX 2048, then an abc rally to SPX 2112. This suggests another abc down will probably end this complex pattern soon.
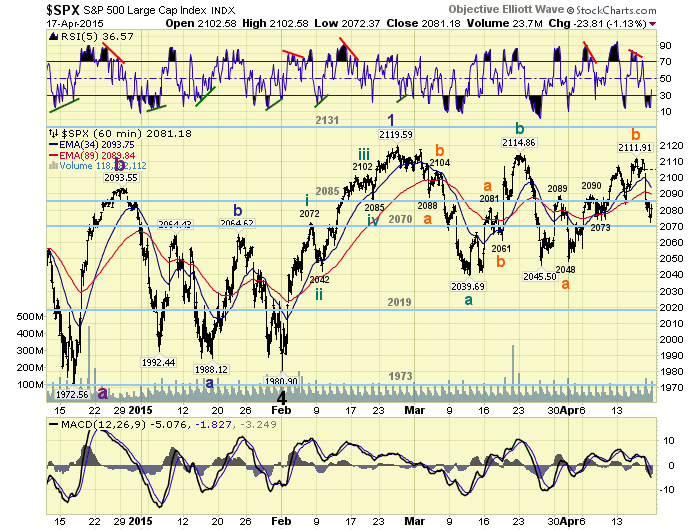
Using the hourly chart labeling. If Minute C equals Minute A then we should see support at SPX 2035. Or if Micro C equals Micro A we should see support at SPX 2043. If we then combine these levels with those mentioned in the section above we arrive with the following support levels: SPX 2042/2043 and SPX 2034/2035. If we then add in the OEW pivot range at 2019 we have a good cluster of potential support to end this pullback/correction. Current short term support is at the 2070 pivot and SPX 2057, with resistance at the 2085 pivot and SPX 2112. Short term momentum ended the week just above oversold.
FOREIGN MARKETS
The Asian markets were quite mixed on the week but gained 0.7%.
The European markets were all lower and lost 3.5%.
The Commodity equity group were mixed for a 0.1% loss.
The DJ World index is still uptrending but lost 0.3%.
COMMODITIES
Bonds are uptrending and gained 0.7%.
Crude is uptrending and gained 8.3%.
Gold is uptrending but lost 0.4%.
The USD appears to be in a correction and lost 1.9%.
NEXT WEEK
Wednesday: FHFA home prices and Existing home sales. Thursday: weekly Jobless claims and New home sales. Friday: Durable goods orders. With the lack of important economic data and nothing scheduled from the FED, it appears this will be a technical week for the stock market. Best to your weekend and week!
CHARTS: http://stockcharts.com/public/1269446/tenpp
http://caldaroew.spaces.live.com
After about 40 years of investing in the markets one learns that the markets are constantly changing, not only in price, but in what drives the markets. In the 1960s, the Nifty Fifty were the leaders of the stock market. In the 1970s, stock selection using Technical Analysis was important, as the market stayed with a trading range for the entire decade. In the 1980s, the market finally broke out of it doldrums, as the DOW broke through 1100 in 1982, and launched the greatest bull market on record.
Sharing is an important aspect of a life. Over 100 people have joined our group, from all walks of life, covering twenty three countries across the globe. It's been the most fun I have ever had in the market. Sharing uncommon knowledge, with investors. In hope of aiding them in finding their financial independence.
Copyright © 2015 Tony Caldaro - All Rights Reserved Disclaimer: The above is a matter of opinion provided for general information purposes only and is not intended as investment advice. Information and analysis above are derived from sources and utilising methods believed to be reliable, but we cannot accept responsibility for any losses you may incur as a result of this analysis. Individuals should consult with their personal financial advisors.
Tony Caldaro Archive |
© 2005-2022 http://www.MarketOracle.co.uk - The Market Oracle is a FREE Daily Financial Markets Analysis & Forecasting online publication.