


Footsie UK Stock Market Final High
Stock-Markets / UK Stock Market Apr 17, 2015 - 10:38 AM GMTBy: Austin_Galt

Today the 16th April 2015 may very well go down as the high of the bull market that began in 2009. Let's take a look at the recent action using the daily chart.
FOOTSIE Daily Chart
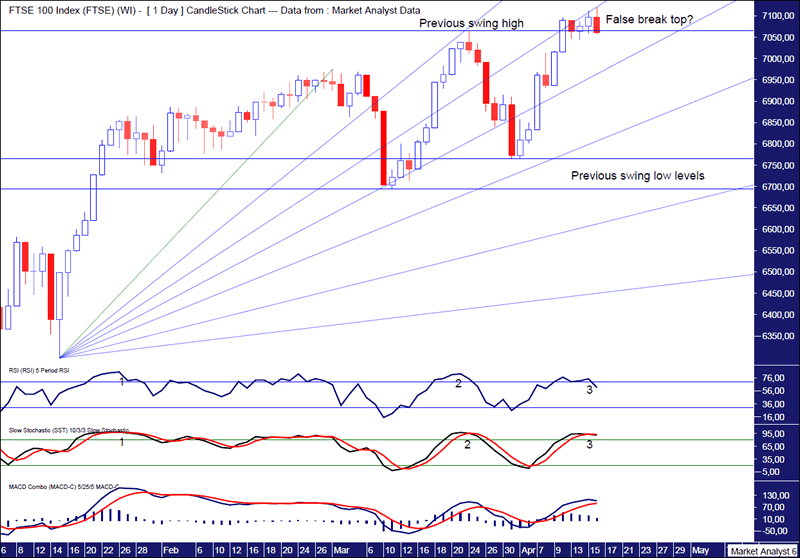
Price hit a high today at 7119 and there is some evidence to suggest that may well be it.
The daily candle today was an outside bearish reversal candle in that the high was higher than yesterday's high while the low was lower and it closed well in negative territory.
The Relative Strength Indicator (RSI) and Stochastic indicator are both showing a triple bearish divergence at this high which often leads to a significant decline.
The Moving Average Convergence Divergence (MACD) indicator has a bearish divergence and the averages look to be coming back together with the potential for a bearish crossover.
Recent price action looks as if a false break top is setting up above the previous swing high level denoted by the upper horizontal line.
I have drawn a Fibonacci Fan which has shown some nice symmetry with price. The previous swing high was right at resistance from the 23.6% angle while this current high is right at resistance from the 38.2% angle.
The downtrend will only be confirmed once price breaks below the previous swing low levels which are denoted by the two lower horizontal lines. These levels stand at 6765 and 6693.
From previous short term analysis we know that this current high is point 5 of a broadening top formation while longer term analysis shows this is the third high in a massive triple top formation.
Summing up, conditions look favourable for a short term high and given previous analysis of the longer term technicals this is very likely the end of the bull market.
And once the high is confirmed, we can investigate likely levels for the bear market to end.
By Austin Galt
Austin Galt is The Voodoo Analyst. I have studied charts for over 20 years and am currently a private trader. Several years ago I worked as a licensed advisor with a well known Australian stock broker. While there was an abundance of fundamental analysts, there seemed to be a dearth of technical analysts. My aim here is to provide my view of technical analysis that is both intriguing and misunderstood by many. I like to refer to it as the black magic of stock market analysis.
Email - info@thevoodooanalyst.com
© 2015 Copyright The Voodoo Analyst - All Rights Reserved
Disclaimer: The above is a matter of opinion provided for general information purposes only and is not intended as investment advice. Information and analysis above are derived from sources and utilising methods believed to be reliable, but we cannot accept responsibility for any losses you may incur as a result of this analysis. Individuals should consult with their personal financial advisors.
Austin Galt Archive |
© 2005-2022 http://www.MarketOracle.co.uk - The Market Oracle is a FREE Daily Financial Markets Analysis & Forecasting online publication.