


EURUSD and USDJPY Double Tops
Currencies / Euro Apr 12, 2015 - 03:25 PM GMTBy: Austin_Galt

 Recent double tops tell the tale for these two currencies. The EURUSD has a bearish double top in place while the USDJPY has a bullish double top in place. A bit confused? Let's get clarity by viewing the daily charts of each currency.
EURUSD Daily Chart
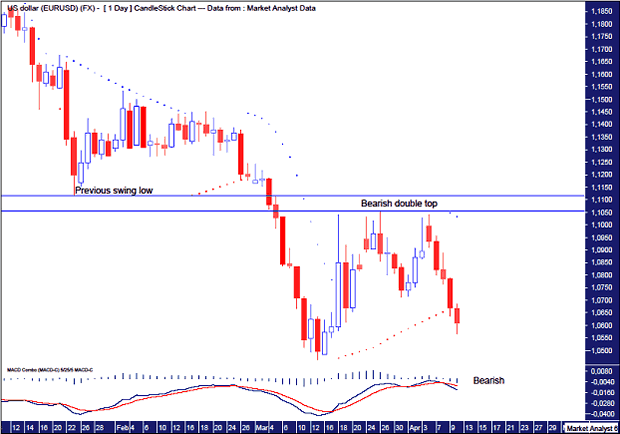
We can see a double top has formed recently at 1.1055 and is denoted by the lower horizontal line. This is a bearish double top as it is with the trend meaning the double top formation is below the previous swing high level. This double top is extra bearish as it is even below the previous swing low level of 1.1115 which is denoted by the higher horizontal line. Bearish double tops generally mean new lows are on the cards.
The PSAR indicator now has a bearish bias after price busted the dots on the downside.
The MACD indicator is now bearish with the red line above the blue line.
So the probability is for new lows in the EURUSD below 1.0462 while price breaking above this double top level now would be very bullish.
Let's now look at the USDJPY.
USDJPY Daily Chart
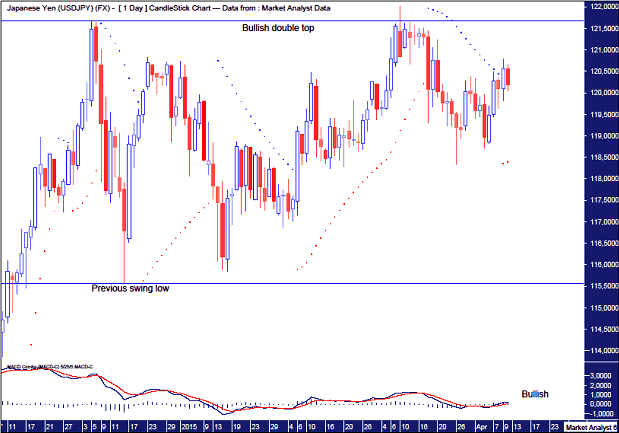
We can see a double top has formed in the USDJPY at 122.01 denoted by the higher horizontal line. This is a bullish double top as it is against the trend being above the previous swing high level. These double tops are great for traders that play the expected reaction down but once the reaction is done price generally trades back up and breaks out above the double top formation.
The PSAR indicator now has a bullish bias with the dots underneath price.
The MACD indicator has a bullish bias with the red line below the blue line.
So the probability is for new highs in the USDJPY while breaking down below the previous swing low level now would be very bearish. This level stands at 115.56 and is denoted by the lower horizontal line.
These two currencies, the EURUSD and USDJPY, are both great examples of the two different types of double tops - bearish and bullish, and their significance for price direction going forward.
By Austin Galt
Austin Galt is The Voodoo Analyst. I have studied charts for over 20 years and am currently a private trader. Several years ago I worked as a licensed advisor with a well known Australian stock broker. While there was an abundance of fundamental analysts, there seemed to be a dearth of technical analysts. My aim here is to provide my view of technical analysis that is both intriguing and misunderstood by many. I like to refer to it as the black magic of stock market analysis.
Email - info@thevoodooanalyst.com
© 2015 Copyright The Voodoo Analyst - All Rights Reserved
Disclaimer: The above is a matter of opinion provided for general information purposes only and is not intended as investment advice. Information and analysis above are derived from sources and utilising methods believed to be reliable, but we cannot accept responsibility for any losses you may incur as a result of this analysis. Individuals should consult with their personal financial advisors.
Austin Galt Archive |
© 2005-2022 http://www.MarketOracle.co.uk - The Market Oracle is a FREE Daily Financial Markets Analysis & Forecasting online publication.