


The Technical Outlook for Crude Oil Price
Commodities / Crude Oil Apr 08, 2015 - 09:00 AM GMTBy: Donald_W_Dony

 Commodities normally go through a multi-year phase of strength and performance against the benchmark S&P 500 and then an approximate equal period of time of underperformance to the U.S. index.
Each stage of this Commodity/Stock cycle, lasts on average about 18 years. This has been the pattern for over 100 years.
For example, in chart 1, from 1980 to 2000, the S&P 500 outperformed the Commodity Research Bureau Index (CRB). From 2000 to 2012, the CRB outperformed the S&P 500. And from 2012 to the present, the U.S. index is again, outperformed the CRB.
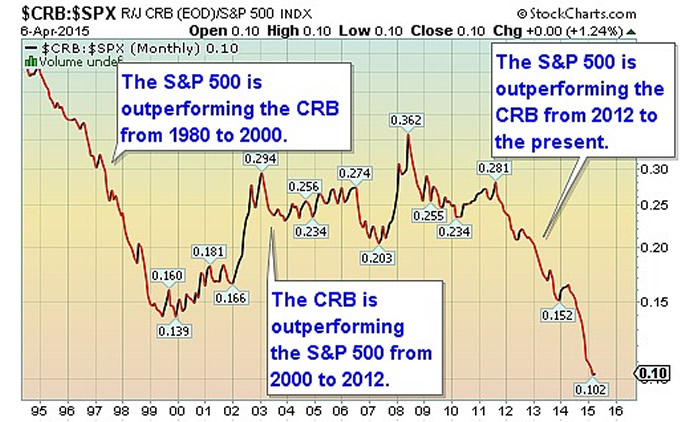
The markets are now in this Stock (S&P 500) cycle.
Energy (crude oil, heating oil and natural gas) equals the largest single component of the CRB. In the 10th revision (2005) of the index, energy now equals approximately 39% of the CRB.
One of the main factors affecting the long-term movement in oil prices is the U.S. dollar.
In chart 2, it shows that there is a moderate opposite corelation between WTI and the dollar. Over the past 15 years, when the trend of the $US is down, as in 2002 through 2009, oil prices have an upward tendency.
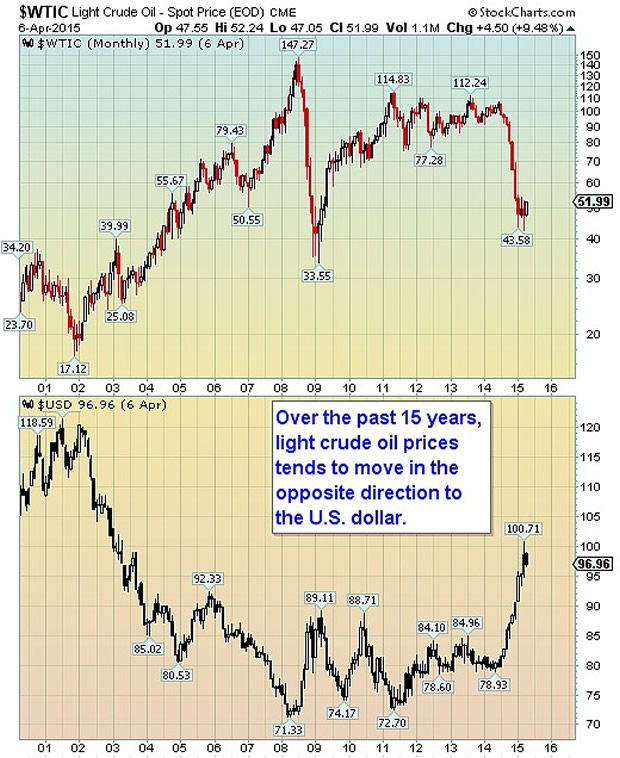
When the dollar bottoms and stabilizes (2009-2014), light crude oil prices no longer advance and "top-out".
And when the U.S. dollar rises (2014 to present), oil prices tend to decline.
One of the main characteristics of a Stock cycle, is strength in the U.S. dollar.
Fueled by stronger economic news than most other G10 countries, plus the eventual interest rate increase in the $US, the outlook for the dollar remains positive and is expected to a continue advance over the next few years with an eventual rise to $1.20.
Next week, part 2 of the Technical outlook for oil.
By Donald W. Dony, FCSI, MFTA
www.technicalspeculator.com
COPYRIGHT © 2015 Donald W. Dony
Donald W. Dony, FCSI, MFTA has been in the investment profession for over 20 years, first as a stock broker in the mid 1980's and then as the principal of D. W. Dony and Associates Inc., a financial consulting firm to present. He is the editor and publisher of the Technical Speculator, a monthly international investment newsletter, which specializes in major world equity markets, currencies, bonds and interest rates as well as the precious metals markets.
Donald is also an instructor for the Canadian Securities Institute (CSI). He is often called upon to design technical analysis training programs and to provide teaching to industry professionals on technical analysis at many of Canada's leading brokerage firms. He is a respected specialist in the area of intermarket and cycle analysis and a frequent speaker at investment conferences.
Mr. Dony is a member of the Canadian Society of Technical Analysts (CSTA) and the International Federation of Technical Analysts (IFTA).
Donald W. Dony Archive |
© 2005-2022 http://www.MarketOracle.co.uk - The Market Oracle is a FREE Daily Financial Markets Analysis & Forecasting online publication.