


The Crude Oil Price Crash and China Economic Slow Down
Economics / China Economy Mar 26, 2015 - 07:25 AM GMTBy: Raul_I_Meijer

 This is another essay from friend and regular contributor of The Automatic Earth, Euan Mearns at Energy Matters.
One comment on my part: Euan says ‘This has lead to speculation that weak global demand, stemming from masked economic woes, may also be playing a key role.‘ I don’t think the use of the term ‘speculation’ is appropriate here, because it seems overly obvious that China’s economic slowdown has played a major role in the oil price crash (and continues to do so). Even if there’s no ‘scientific’ proof, and even if the main media narrative remains OPEC overproduction and the inane meme of the cartel’s refusal to cut production, it certainly goes way beyond mere speculation.
Euan:
Two of the factors in the oil price crash are well constrained: 1) oversupply of expensive light tight oil (LTO) in North America and 2) the decision of OPEC to not cut production. The third possible factor of weak global demand is not so easy to constrain but the current oil price crash bears many of the same hallmarks as the 2008 finance crash. This has lead to speculation that weak global demand, stemming from masked economic woes, may also be playing a key role.
In response to this, commenter Javier sent me a collection of 10 charts that he had collected from various internet sources together with his commentary that forms the basis of this joint-post. These charts tell a clear story of a major economic slowdown in China. This most certainly will be implicated in the ongoing oil price weakness. The $10,000 question is will China make a cyclical rebound like it has done in the past?
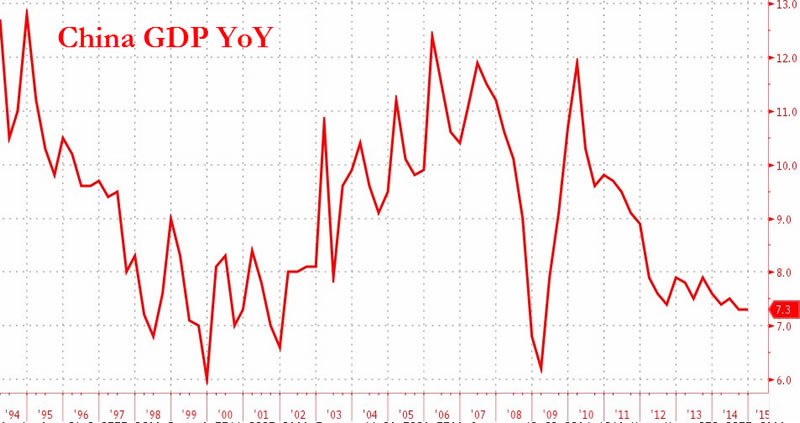
Figure 1 GDP growth. YoY = year on year % change. Note many charts are not zero scaled. China’s economy is still growing at 7% per year but has slowed down dramatically from 12% 5 years ago. Such change has happened before, notably between 1994 and 1998 linked to the Asian currency crisis. The oil price hit $10 per barrel in 1998. And in 2007 to 2009 an even more sharp fall related to the financial crash was also accompanied by a crash in the oil price.
Javier points out that in a country with rapid population growth a higher GDP growth rate is required than in a country with stable or declining population and he suggests that 7% is in reality approaching recessionary levels.
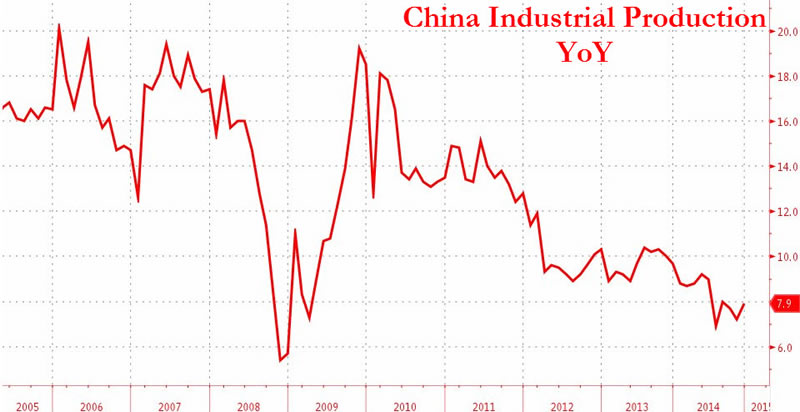
Figure 2 Decline in the growth rate of industrial production mirrors the decline in the growth rate of GDP (Figure1).
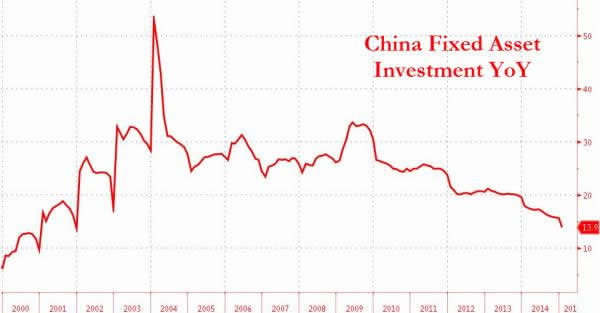
Figure 3 Fixed Asset Investment is a technical measure of investment in hard assets, infrastructure, property and plant and machinery. The graph tells the story of a country growing at phenomenal and increasing rates of growth up to 2005, that is the definition of exponential growth. From 2005 to 2009 the growth rate was flat, i.e. the growth was linear. From 2010 China is investing in fixed assets at decreasing rates of growth.
The change in 2005 is coincident with a change in growth and oil consumption in many OECD countries and therefore indicates that a global source of economic distress took place at about that date. China is changing the way it grows as it is not possible to grow exponentially forever.
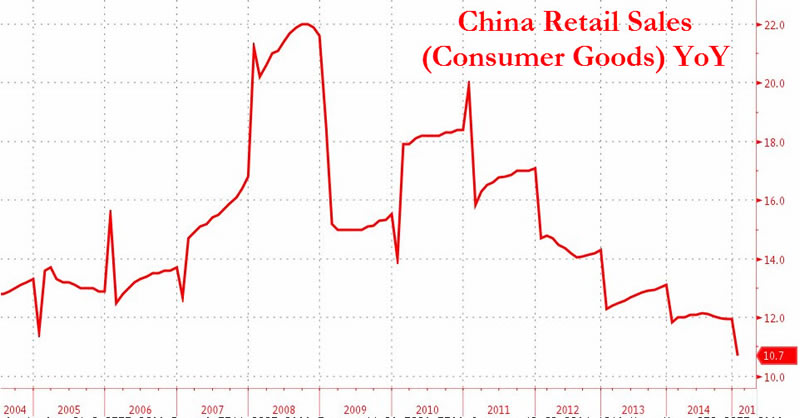
Figure 4 Retail sales is a measure of national consumer expenditure. 2008 was the year of the Beijing Olympic Games, so we can pretty much discount the strong peak that year and see in this graph a strong growth in consumer expending until 2010. Since then retail sales have being growing at a slower rate, and current rate of growth is the slowest in ten years.
Retail sales growth will be driven by two factors. 1) the number of individuals economically active which in China grew at a phenomenal rate with the great migration to the cities and 2) the prosperity of those economically active.
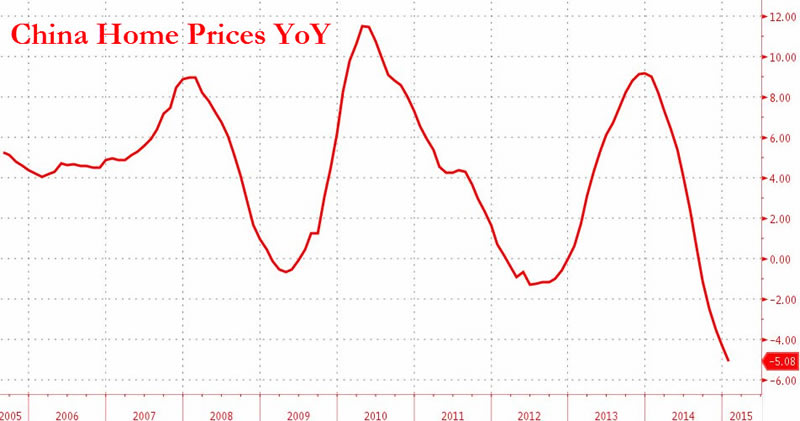
Figure 5 Unlike in the previous graphs, China home prices have recently gone into an actual negative rate of change, which means that home prices are actually decreasing in China. If unchecked this could become a serious problem for China since real estate represents about 75% of household assets. So home prices are important for how Chinese perceive their own wealth. Falling house prices also lead to the risk of negative equity where the asset value falls below the amount of debt secured against the asset.
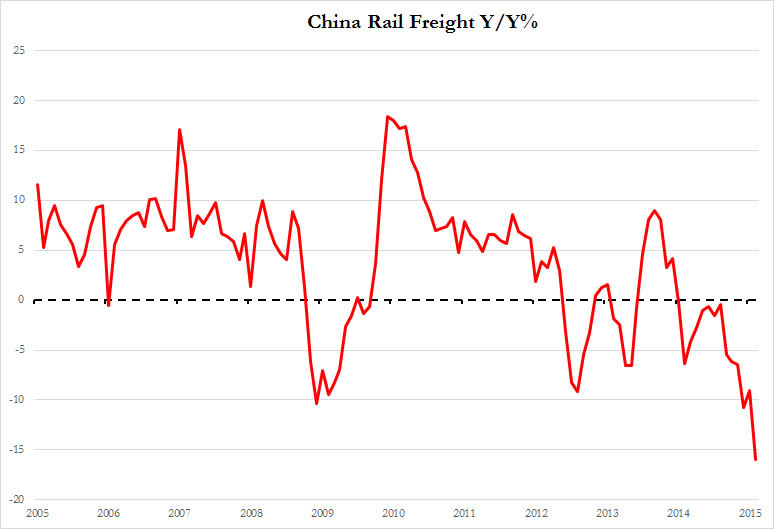
Figure 6 Rail freight is now falling at 16% per annum having gone into negative territory in mid 2014. In the case of China this is a measure mainly of national trade. This mirrors the picture of falling international trade as indicated by the sharp fall in the Baltic Dry Shipping Index.
Figure 7 Consumer Price Index (CPI) measures the average change over time in the prices paid by consumers on a representative basket of goods and services, while Producer Price Index (PPI) measures the average change over time in the selling prices received by domestic producers for their output. PPI shows an abrupt worsening for producers in 2011, since then the timid recovery ended badly in mid 2014 and PPI is now at levels found during recession. CPI shows that China is also flirting with deflation, which is bad news for banks and all individuals and organisations that have debt.
Figure 8 This graph shows that as export growth has stalled and imports are actually declining since 2013 and specially since mid 2014. This is one of the main causes of the commodity price crash that includes oil. China is buying less raw materials which is bad news for commodity producers that depend on China, like Australia. Note exports are still well in excess of imports and China still runs a huge balance of trade surplus.
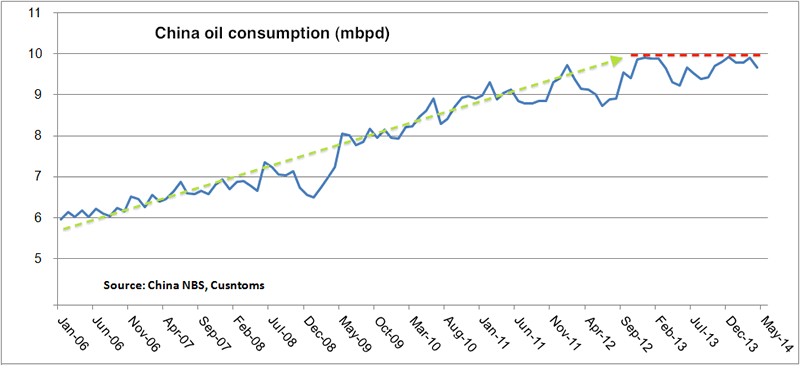
Figure 9 Growth in oil consumption in China underpinned the bull run in the oil price. This growth in consumption stalled in 2012. The reasons for this should be clear from the preceding charts.
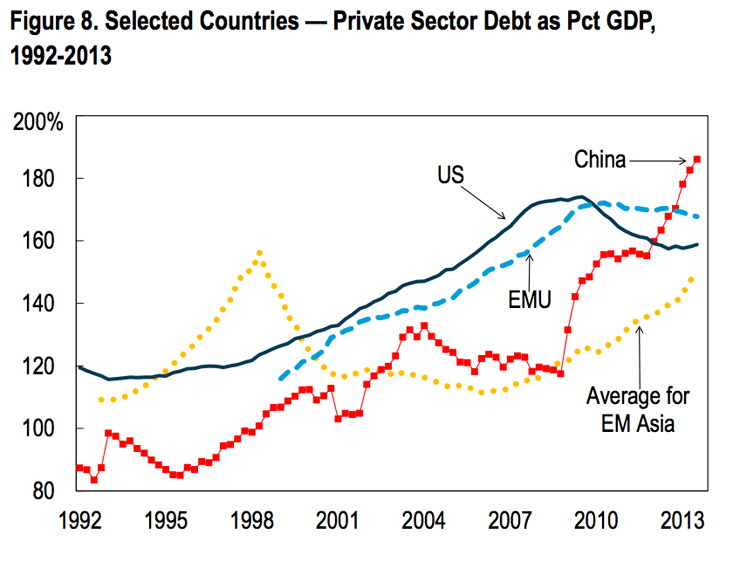
Figure 10 The phenomenal growth in China has been fuelled in part by an equally phenomenal growth of debt. The chart shows private sector debt has gone from much lower than OECD countries to much higher in just two decades. Debt is a fantastic growth hormone, but it is subject to a very strong diminishing returns curve. When there is too much in the system, it becomes a growth inhibitor.
Summary
A wide range of economic measures shows that China is undergoing a period of rapid economic slow down and is flirting with recession. China has grown to become the world’s second largest economy and strong Chinese growth has underpinned global growth for many years. Without it, the world faces the risk of another global recession. The slowing of growth in China means a softening of demand for natural resources, including oil and softening of demand for consumer products made in Europe and the USA.
Low oil prices may help stimulate growth in China and without this stimulus the global economy may already have been in recession.
Many of the charts are simply thermometers of the Chinese economy. Three of the measures, however, give rise to more concern about China’s ability to climb out of the malaise as it has done before. Falling property values, risk of deflation and debt saturation. Like many of the world’s leading economies, China, appears to have driven into the same economic cul-de-sac.
Sources of charts
Zerohedge
Dr. Ed’s Blog
Snake oil trading blog
Who is Javier?
Javier holds a PhD in Biochemistry and Molecular Biology and has been a scientist for 30 years in molecular genetics and neurobiology. He wrote a blog on macroeconomy and investments from a cyclic point of view for over two years and currently writes a blog in Spanish about the economic crisis, energy crisis and climate change under the pseudonym Knownuthing.
By Raul Ilargi Meijer
Website: http://theautomaticearth.com (provides unique analysis of economics, finance, politics and social dynamics in the context of Complexity Theory)© 2015 Copyright Raul I Meijer - All Rights Reserved Disclaimer: The above is a matter of opinion provided for general information purposes only and is not intended as investment advice. Information and analysis above are derived from sources and utilising methods believed to be reliable, but we cannot accept responsibility for any losses you may incur as a result of this analysis. Individuals should consult with their personal financial advisors.
Raul Ilargi Meijer Archive |
© 2005-2022 http://www.MarketOracle.co.uk - The Market Oracle is a FREE Daily Financial Markets Analysis & Forecasting online publication.