


Everyone Is Guessing When It Comes To Crude Oil Prices
Commodities / Crude Oil Mar 11, 2015 - 12:33 PM GMTBy: OilPrice_Com

 Predicting and diagnosing the trajectory of oil prices has become something of a cottage industry in the past year. But along with all of the excess crude flowing from the oil patch, there is also an abundance of market indicators that while important, tend to produce a lot of noise that makes any accurate estimate nearly impossible.
First there is the oil price itself. The crash began last summer, and accelerated in November. Since then, predictions for oil prices for 2015 have been all over the map – from Citigroup's $20 per barrel, to T. Boone Pickens' prediction of a return to $100 per barrel. OPEC's Secretary-General even said prices could shoot up to $200 in the coming years as a result of overly drastic cutbacks and a failure to invest in new production. With those estimates at the extremes, most analysts think prices will continue to seesaw within a rough band of $40 to $70 for the rest of the year. Still that is quite a large range, highlighting the fact that everyone is merely guessing.
Aside from oil prices, the weekly measurement of the number of rigs still in operation has become one of the most watched indicators out there. Weekly rig counts from Baker Hughes have sparked the Twitter hashtag #Rigcountguesses, to which energy analysts post their predictions. For the week ending March 6, another 75 oil and gas rigs were pulled from operation, taking the total down to 1,192. That is the lowest level in years, and 43 percent lower than its 2014 peak. While the rig count metric has garnered a lot of attention as a leading indicator of a potential cut back in oil production, it has also been criticized for not being an entirely accurate portrayal of output. Drillers have become more efficient, able to use fewer rigs for the same amount of production. So the notion that a falling rig count will necessarily lead to a fall in production may be a bit more complicated than it seems.
A new metric that has popped up in recent weeks is the level of available storage. Excess oil has been stashed in storage tanks around the world, but government data suggests that storage space is starting to run low. The EIA says that about 60 percent of total U.S. storage is filled, a jump from 48 percent a year ago. Regional figures are higher, for say, the East Coast (85 percent). Oil storage is at its highest level in 80 years, and storage at the all-important hub in Cushing, Oklahoma could begin to run out of space this spring. Globally, the picture isn't any better – Citigroup says Europe is at 90 percent, while South Korea, South Africa, and Japan may all be nearing 80 percent. The growing shortage of places to put oil has led to the creation of an oil-storage futures contract by CME Group. As storage begins to run out, the glut could worsen, sending prices way down.
Another key number to keep in mind is the number of drilled but uncompleted wells out there. There are an estimated 3,000 wells that have not been completed as producers wait for prices to rebound. Instead of storing oil in tanks, simply holding off on finishing a well can allow drillers to "store" oil in the ground. Once completed, however, the backlog of wells will push down prices.
The most important indicator for trying to figure out where prices are going is actual levels of oil production. In the face of spending cut backs, drops in rig counts, and ongoing price pressure, oil production continues to defy gravity. Output continues to climb. At the end of February, the U.S. was producing 9.3 million barrels per day, up 10 percent since prices began crashing in June 2014, and even up 2 percent since the beginning of 2015. Low prices have yet to cut into the trend line, but will have to at some point soon.
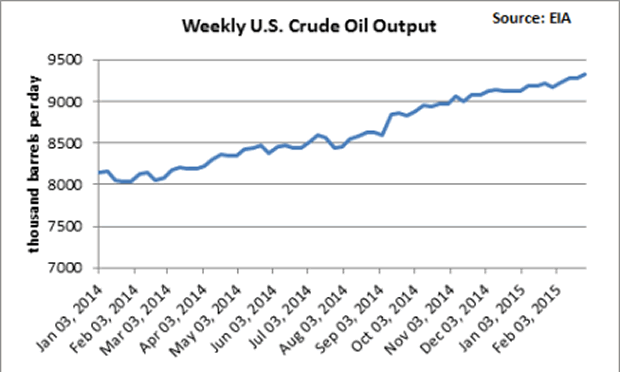
Image URL: https://oilprice.com/images/tinymce/Evan1/ada1896.png
One of the big unknowns is how oil demand will respond to low prices. Lower prices should push up consumption, but how quickly and how fervently consumers respond will go a long way to determining when the glut will subside. Overall demand is also largely determined by broader economic growth. With so much unknown about the rate of economic expansion around the world, demand projections are understandably all over the place. The IEA, OPEC, and EIA – the three most-watched energy prognosticators – have tinkered with their oil demand scenarios, but they haven't yet seen enough evidence to forecast a surge in demand.
Finally, clouding the entire picture are fluctuations in currency markets. Fluctuations in currencies influence – and are also influenced by – fluctuations in oil prices. Most important is the U.S. dollar because oil prices are priced in dollars. Just to take a recent example, the U.S. posted very positive employment numbers on March 6. While that should theoretically put upward pressure on oil prices because a stronger economy should lead to more oil consumption, oil prices actually fell. Why? A stronger economic outlook also raised speculation that the Federal Reserve may increase interest rates, which would strengthen the dollar. Since oil is priced in dollars, a stronger dollar tends to push down oil prices.
The set of indicators above is just a small selection of what energy prognosticators have to take into account when trying to predict oil prices. When you throw in geopolitics, technological advances, and changes in tax policy, for example, one quickly realizes that nobody knows which way oil prices are heading.
Source: http://oilprice.com/Energy/Oil-Prices/Everyone-Is-Guessing-When-It-Comes-To-Oil-Prices.html
By Nick Cunningham of Oilprice.com
© 2015 Copyright OilPrice.com- All Rights Reserved
Disclaimer: The above is a matter of opinion provided for general information purposes only and is not intended as investment advice. Information and analysis above are derived from sources and utilising methods believed to be reliable, but we cannot accept responsibility for any losses you may incur as a result of this analysis. Individuals should consult with their personal financial advisors.
© 2005-2022 http://www.MarketOracle.co.uk - The Market Oracle is a FREE Daily Financial Markets Analysis & Forecasting online publication.