


Copper Commodity Price Technical Outlook
Commodities / Copper Feb 22, 2015 - 01:01 PM GMTBy: Austin_Galt

 Copper got a bit of press attention recently with headlines of a plunge in price. This was in early January and I hadn't looked at the copper chart for a few days and I was gobsmacked when I did. A plunge they say?! What a load of baloney!! If that was a plunge then they are in for a big shock later this year if my analysis is correct.
But let's not get ahead of ourselves. Let's start with the small picture and then come back to the big picture which will reveal the likely shock in store.
Copper Daily Chart
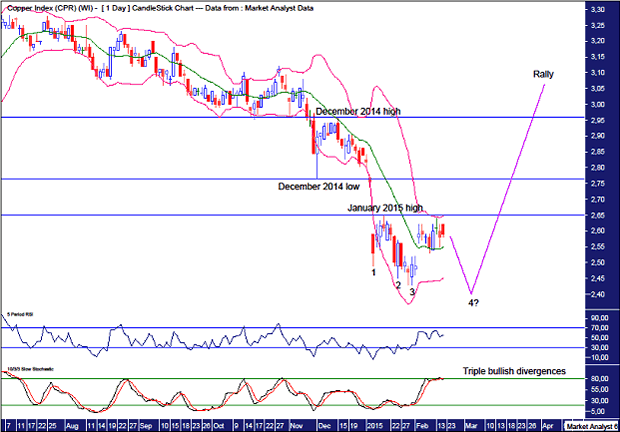
The recent low was a "three strikes and you're out" low consisting of three consecutive lower lows. This low was also accompanied by triple bullish divergences on the Relative Strength Indicator (RSI) and Stochastic indicator. This generally leads to a significant rise and while price has risen from that low the nature of the rise is nothing to rave about.
Price has so far failed to take out the January 2015 high at US$2.65 which is denoted by the lowest horizontal line. Taking this into consideration, I believe price may be headed for a fourth lower low which is also accompanied by quadruple bullish divergences on the same lower indicators. That occurring really should lead to a substantial rally. Let's see.
The Bollinger Bands show price bouncing up to the upper band and perhaps one last move back to the lower band is in store before a decent rally takes place.
Other points of resistance are denoted by the higher horizontal lines which stem from the December 2014 low and December 2014 high and I favour any coming rally to take out these levels.
Now let's skip to the monthly chart to begin examining the bigger picture.
Copper Monthly Chart
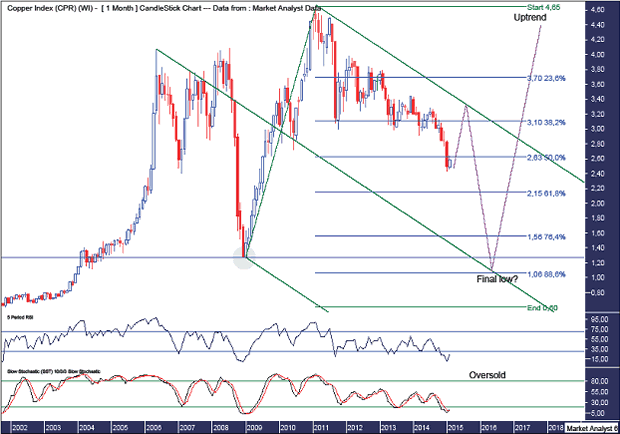
The RSI and Stochastic indicator are both in oversold territory so a rally should be on the cards shortly. However, both these indicators have readings showing new lows so any rally from here is likely to be a bear market rally. I would like to see the final low be accompanied by bullish divergences on the lower indicators.
I have drawn an Andrew's Pitchfork which shows price trending down within the upper channel of this bearish pitchfork. If a rally is to take place soon then I am looking for price to test the upper channel line. And considering I expect a bear rally only then price should be rejected at this upper trend line.
So where is the final low likely to be?
I have drawn a green highlighted circle which shows where price exploded higher in a parabolic move. This area is at the 2008/09 lows of US$1.27. Price plunged into that low and them immediately launched higher in explosive style. Price often eventually corrects to these areas and I favour exactly that to play out here.
I have added Fibonacci retracement levels of the move up from 2001 low at US$0.60 to the all time high in 2011 at US$4.65. I am looking for a deep retracement that closes in on the 88.6% level at US$1.06 which would see price clipping the zone whereby price launched higher parabolic style.
Price putting in a low there around mid 2016 would also be at support from the middle trend line of the Andrew's Pitchfork.
Let's now look at the yearly chart to get another perspective.
Copper Yearly Chart
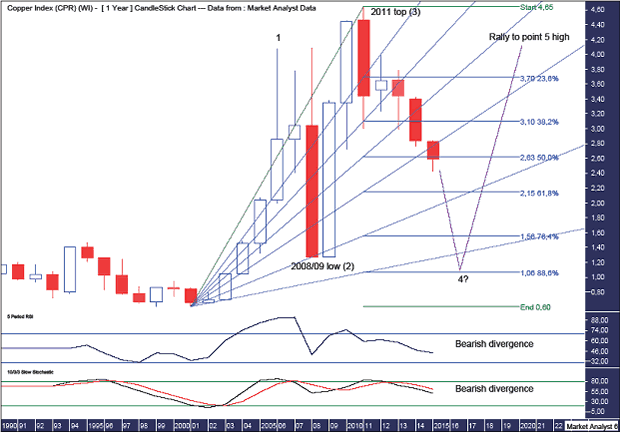
The recent high in 2011 showed a bearish divergence on the RSI and Stochastic indicator. These indicators now appear to be trending down and not looking particularly promising for the bulls.
I have added the same Fibonacci retracement levels from the monthly chart just to give a different perspective.
I have also added a Fibonacci Fan which shows the 2008/09 low was around support given from the 76.4% angle. I am looking for the next major low to clip the 88.6% angle. Time will tell.
If I am reading this correctly, then a massive 5 point broadening top is in play and price is now headed down to make a point 4 low. In this scenario, the 2006 high was point 1, the 2008/09 low point 2, the 2011 high point 3. If we do indeed get a point 4 low then I expect price to once again explode to new all time highs over the coming years as price eventually puts in the point 5 high.
And I'd like to see the final point 5 high be accompanied by triple bearish divergences in the lower indicators.
So while the move down in early January garnered some headlines, it really wasn't a major plunge. The real plunge is still to come. And expect much bigger headlines to come with it!
By Austin Galt
Austin Galt is The Voodoo Analyst. I have studied charts for over 20 years and am currently a private trader. Several years ago I worked as a licensed advisor with a well known Australian stock broker. While there was an abundance of fundamental analysts, there seemed to be a dearth of technical analysts. My aim here is to provide my view of technical analysis that is both intriguing and misunderstood by many. I like to refer to it as the black magic of stock market analysis.
© 2015 Copyright The Voodoo Analyst - All Rights Reserved
Disclaimer: The above is a matter of opinion provided for general information purposes only and is not intended as investment advice. Information and analysis above are derived from sources and utilising methods believed to be reliable, but we cannot accept responsibility for any losses you may incur as a result of this analysis. Individuals should consult with their personal financial advisors.
© 2005-2022 http://www.MarketOracle.co.uk - The Market Oracle is a FREE Daily Financial Markets Analysis & Forecasting online publication.