


What This "Ice Level" Means to Future Oil Prices
Commodities / Crude Oil Feb 19, 2015 - 04:04 PM GMTBy: Money_Morning

 D.R. Barton writes: You'd have to be living under a rock (and one without Internet access at that) to have missed the oil price swoon that has taken place since June.
Even after a recent bounce back from an under-$50 per barrel low, and a trough-to-peak rebound of 24% since the end of January, the technical picture does not indicate smooth sailing upward from here.
In fact, if there's only one metric we need to look at to determine where oil prices are going, it would be this one, and it's not showing the type of move we're hoping for any time soon.
In fact, it shows oil will have trouble "breaking the ice"…
Three Technical Indicators That Can Hold Oil Down in the Near Term
We'll use three of my favorite technical tools to see what could keep crude from rallying in the near term. Let's dig in right now.
Indicator No. 1: The Descending 50-Day Moving Average
There are two moving averages that are almost ubiquitous with institutional traders – the 200 day and the 50 day – representing the longer-term and intermediate-term time frames.
We'll concentrate on the intermediate-term, 50-day indicator here.
A simple moving average is mathematically very easy to calculate. For a 50-day moving average, just add up all of the closing prices of the stock (or whatever instrument you're interested in) for the last 50 trading days, divide the total by 50, and plot the result on the price graph.
If the price of the stock is below the moving average, then current price action is weaker than that of the last 50 days. If price is above the moving average, current price activity is strong relative to its history.
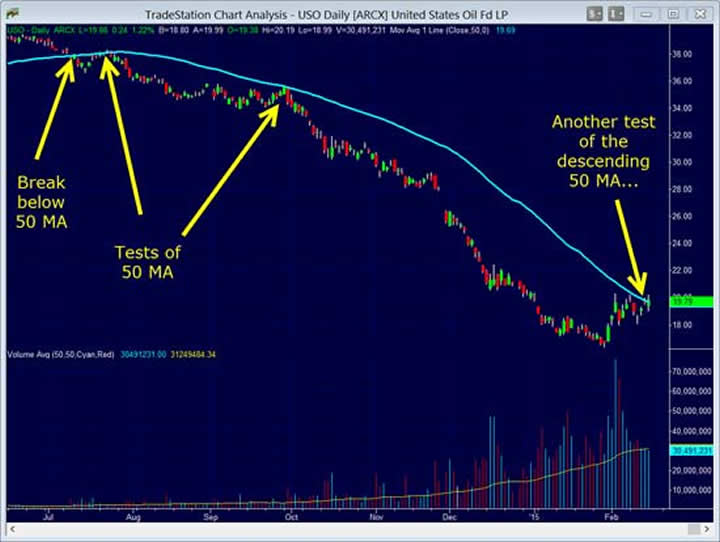
Let's take a look at a chart showing the United States Oil Fund LP ETF (NYSE Arca: USO) and its 50-day moving average:
After crude broke below its 50-day moving average in July, it tested it later that month, again in September and then was so weak that it did not muster enough of rally to test that area again until the middle of February.
The descending 50-day moving average forms a strong overhead resistance level by itself – but there are other two other reasons to expect that oil will have a tough time breaking above this congestion level.
Indicator No. 2: Wyckoff's Famous "Ice" Level
Richard Wyckoff was one of the fathers of technical analysis in the early 20th century. His concepts were so useful and comprehensive that they are still in wide use today.
One of Wyckoff's concepts was that of an "ice level" – an area of price support that when broken signals a clear "sign of weakness." These ice levels can occur after uptrends reverse or as downtrends continue. Wyckoff called price acceleration through a defined support level "falling through the ice" – a very simple-to-understand concept that happened in crude most recently in December:
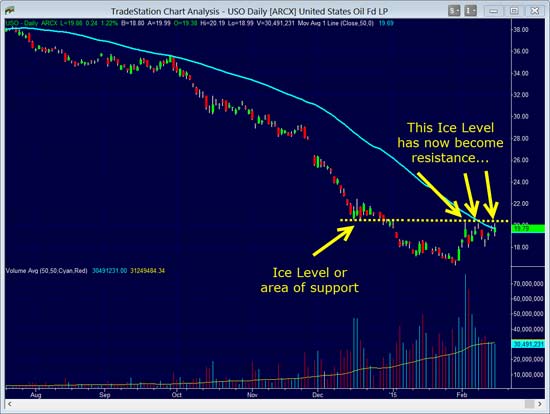
Once again we see the $20 to $20.50 zone in USO acting as resistance in this current price move, and it will take a serious push to break up through this "ice level" from below.
And that move is made even more difficult by the weakening energy of the bullish cause as evidenced in our final indicator…
Indicator No. 3: Loss of Volume Not Helping the Bullish Cause
The recent price action in USO has been quite volatile and volume has picked up drastically over the last 10 weeks. This shows a tug-of-war going on between buyers and sellers. In traditional basing patterns, we usually see a drop-off in volume. So there's still a battle royal being held in the world of crude.
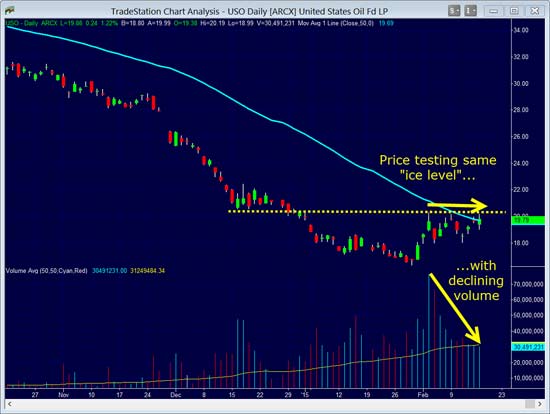
The biggest volume day in USO of the last several years happened when it looked like price might finally be breaking out on February 3, only to have price pull back from the "ice level" as shown in the previous graph.
However, both of the subsequent tests of the ice level have come with much lower volume, showing declining energy as we can see on accompanying chart:
Fundamental factors for crude may eventually bolster crude prices. Supply may eventually drop instead of increasing week after week (despite severely reduced rig counts here in the United States).
A Final Word on Oil Price Direction
Tensions may escalate in oil-rich regions. Many news-driven scenarios could pop crude prices higher.
But for the short term, there are some significant technical hurdles for crude to overcome to get to higher price levels.
And in the absence of news flow or other upsets to the underlying fundamentals, these technical obstacles and the short-term supply/demand status quo have a high probability of keeping prices depressed into the spring.
Source :http://moneymorning.com/2015/02/19/what-this-ice-level-means-to-future-oil-prices/
Money Morning/The Money Map Report
©2014 Monument Street Publishing. All Rights Reserved. Protected by copyright laws of the United States and international treaties. Any reproduction, copying, or redistribution (electronic or otherwise, including on the world wide web), of content from this website, in whole or in part, is strictly prohibited without the express written permission of Monument Street Publishing. 105 West Monument Street, Baltimore MD 21201, Email: customerservice@moneymorning.com
Disclaimer: Nothing published by Money Morning should be considered personalized investment advice. Although our employees may answer your general customer service questions, they are not licensed under securities laws to address your particular investment situation. No communication by our employees to you should be deemed as personalized investent advice. We expressly forbid our writers from having a financial interest in any security recommended to our readers. All of our employees and agents must wait 24 hours after on-line publication, or after the mailing of printed-only publication prior to following an initial recommendation. Any investments recommended by Money Morning should be made only after consulting with your investment advisor and only after reviewing the prospectus or financial statements of the company.
Money Morning Archive |
© 2005-2022 http://www.MarketOracle.co.uk - The Market Oracle is a FREE Daily Financial Markets Analysis & Forecasting online publication.