Markets Fear Factor Meets The Year Five Phenomenon
Stock-Markets / Financial Markets 2015 Feb 19, 2015 - 03:51 PM GMTBy: Clif_Droke
 Despite continued front-page fears over Greece's threatened exit from the euro and the military encroachments of the terrorist group known as ISIS, investors apparently aren't sufficiently worried enough to sell equities. If anything, adage about the "wall of worry" has been the driving force behind recent equity market gains as the front-page fears have been largely ignored.
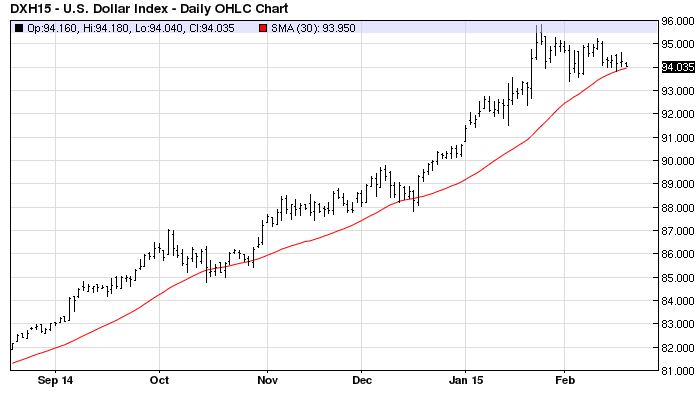
Investors were skittish entering 2015, so much so that billions were poured into safe haven assets including U.S. Treasuries and precious metals. The soaring U.S. dollar (below) was as much a sign of the flight to safety as it was a symptom of U.S. economic strength.

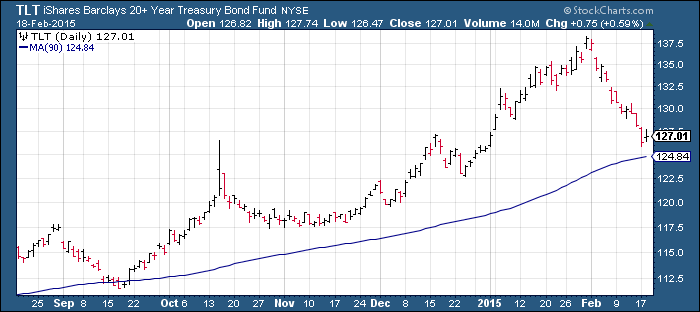
Since the start of February, however, there has been a conspicuous change in investors' perceptions of the foreseeable future. To begin with, the sudden reversal of investor fear can be seen in the chart of the iShares 20+ Year Treasury Bond ETF (TLT), a proxy for the U.S. bond market. Treasury prices haven't fallen this sharply since the May-September 2013 period, which also marked a period of increasing confidence in the future outlook for U.S. consumers and investors. During that period, Treasuries and other safety assets underperformed vis-à-vis risk assets such as stocks.

Another indication that investors have cast off their worries (at least for now) is the dramatic plunge in the Dow Jones Utility Average (DJUA). The utilities have given back all their gains from the last two months and are experiencing their worst performance since 2013. Utility stocks normally follow the direction of bond prices, so it's not surprising to see the DJUA's recent weakness given the recent sell-off in Treasuries. The relatively higher yields that utility stocks typically command along with their safety-oriented reputation make them attractive to investors seeking safety. The utilities benefited from the increased investor pessimism of the late 2014/early 2015 period. Now the safe haven utility stocks are suffering along with gold from the unwinding of the "fear trade."
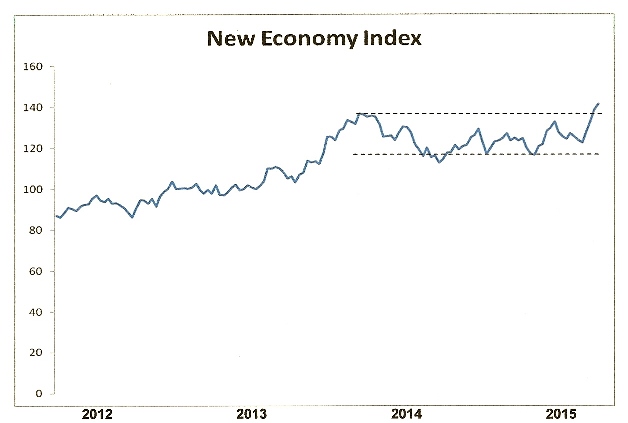
Concomitant with the subsiding of investor fear is the breakout to a record high in the New Economy Index (NEI). NEI is comprised by averaging the stock prices of the most economically sensitive companies within the consumer retail and business sectors, including Amazon (AMZN), Fed-Ex (FDX), and Wal-Mart (WMT). After spending most of 2014 in a lateral trading range, NEI broke out above the 1-year trading range ceiling earlier this month and followed it up with another high last week. The implication behind the breakout in the NEI is that consumers and business owners are increasing their spending levels as we head further into 2015, a sign of increasing consumer confidence.

The true state of the U.S. economy has been the subject of heated debate lately. Going strictly by the accounts offered by many respected economists, including Ed Yardeni and Scott Grannis, spending levels on both the consumer and business levels are quite healthy. Government statistics bear this out, as do various consumer confidence polls. Yet some analysts insist that the government's numbers are "cooked" and do not accurately reflect the underlying state of the economy.
According to an Associated Press article, while the official unemployment rate has fallen to 5.6 percent, average hourly wages have declined. It was also reported last month that a record 92,898,000 Americans are not currently in the workforce. One news service even reported that there are still over 46 million Americans who are food stamp recipients. As one analyst concluded, "It is quite obvious that the official numbers by the government are often very deceptive."
So who is right - the mainstream analysts who contend that the U.S. economy is on the mend or the naysayers who claim the economy remains stuck in neutral (or worse)? The source of the confusion can be traced to misguided attempts at generalizing the enormous and multifaceted U.S. economy. The economy is much like the weather in that any attempt at creating a compressed generalization is bound to cover a multitude of important details. The economy, much like the weather, covers a broad geographic area can only produce a very sloppy "average" picture while ignoring the scores of micro-climates within that picture. What is commonly called the "economy" is simply a snapshot of the United States based on averaging the data within various sectors.
Conventional economic analysis also tends to lump the various socio-economic strata - namely lower, lower-middle, middle, upper-middle and upper classes - into a single broad category. Presently the U.S. upper-middle and upper classes are in a much more prosperous condition than are the lower-to-middle classes. Because the higher income groups account for so much of the big ticket purchases it tends to gloss over the fact that the middle and lower income strata have lagged. This is one reason for the differing accounts behind the U.S. recovery.
It's often overlooked that at its core the U.S. economy is essentially a financial economy. The financial sector accounts, directly or indirectly, for a huge percentage of total economic activity. This is why central bank policy is paramount to the overall state of economic activity in America. Quantitative easing (QE) directly benefits the financial market by inflating stock prices, which in turn benefits the financial sector (the economy's major component). As long as the financial sector is growing, it's only a matter of time before the rest of the economy follows suit.
There's no denying the strength in the New Economy Index (NEI) previously discussed. An expanding NEI is tangible proof that consumers are spending at increasing levels while businesses which cater directly to consumers are also seeing increased sales. This will eventually filter into the broader economic statistics used by economists. NEI is essentially a real-time reflection of consumer spending levels.
In the wake of the 1930s Great Depression, Freeman Tilden made this timely observation:
"In a great state in prosperity, things are never as good as they seem; on the other hand, in adversity they are never as bad as they seem. This is why contemporary prediction is nearly always wrong. Long after a tottering state should have fallen it is propped by the patient, law-abiding, submerged, industrious and thrifty middle class, and by the mere habit of existing. The heart continues resolutely to beat."
Sometimes the lag between a financial market turnaround and a general recovery in consumer finances can be quite long, as was the case in the 1930s and 1970s. Given that the U.S. suffered its worst financial catastrophe since the Great Depression in 2008, it's to be expected that a broad-based economic recovery has been very slow in arriving. As long as the financial sector remains healthy and monetary liquidity remains loose, the beleaguered middle class will eventually see improvement in its economic prospects. Despite proclamations to the contrary from pundits, the U.S. middle class will emerge from the Great Recession in a stronger state.
Mastering Moving Averages
The moving average is one of the most versatile of all trading tools and should be a part of every investor's arsenal. The moving average is one of the most versatile of all trading tools and should be a part of every investor's arsenal. Far more than a simple trend line, it's a dynamic momentum indicator as well as a means of identifying support and resistance across variable time frames. It can also be used in place of an overbought/oversold oscillator when used in relationship to the price of the stock or ETF you're trading in.
In my latest book, "Mastering Moving Averages," I remove the mystique behind stock and ETF trading and reveal a completely simple and reliable system that allows retail traders to profit from both up and down moves in the market. The trading techniques discussed in the book have been carefully calibrated to match today's fast-moving and sometimes volatile market environment. If you're interested in moving average trading techniques, you'll want to read this book.
Order today and receive an autographed copy along with a copy of the book, "The Best Strategies For Momentum Traders." Your order also includes a FREE 1-month trial subscription to the Momentum Strategies Report newsletter: http://www.clifdroke.com/books/masteringma.html
By Clif Droke
www.clifdroke.com
Clif Droke is the editor of the daily Gold & Silver Stock Report. Published daily since 2002, the report provides forecasts and analysis of the leading gold, silver, uranium and energy stocks from a short-term technical standpoint. He is also the author of numerous books, including 'How to Read Chart Patterns for Greater Profits.' For more information visit www.clifdroke.com
Clif Droke Archive |
© 2005-2022 http://www.MarketOracle.co.uk - The Market Oracle is a FREE Daily Financial Markets Analysis & Forecasting online publication.


