Most Popular
1. It’s a New Macro, the Gold Market Knows It, But Dead Men Walking Do Not (yet)- Gary_Tanashian
2.Stock Market Presidential Election Cycle Seasonal Trend Analysis - Nadeem_Walayat
3. Bitcoin S&P Pattern - Nadeem_Walayat
4.Nvidia Blow Off Top - Flying High like the Phoenix too Close to the Sun - Nadeem_Walayat
4.U.S. financial market’s “Weimar phase” impact to your fiat and digital assets - Raymond_Matison
5. How to Profit from the Global Warming ClImate Change Mega Death Trend - Part1 - Nadeem_Walayat
7.Bitcoin Gravy Train Trend Forecast 2024 - - Nadeem_Walayat
8.The Bond Trade and Interest Rates - Nadeem_Walayat
9.It’s Easy to Scream Stocks Bubble! - Stephen_McBride
10.Fed’s Next Intertest Rate Move might not align with popular consensus - Richard_Mills
Last 7 days
Stocks Correct into Bitcoin Happy Thanks Halving - Earnings Season Buying Opps - 4th July 24
24 Hours Until Clown Rishi Sunak is Booted Out of Number 10 - UIK General Election 2024 - 4th July 24
Clown Rishi Delivers Tory Election Bloodbath, Labour 400+ Seat Landslide - 1st July 24
Bitcoin Happy Thanks Halving - Crypto's Exist Strategy - 30th June 24
Is a China-Taiwan Conflict Likely? Watch the Region's Stock Market Indexes - 30th June 24
Gold Mining Stocks Record Quarter - 30th June 24
Could Low PCE Inflation Take Gold to the Moon? - 30th June 24
UK General Election 2024 Result Forecast - 26th June 24
AI Stocks Portfolio Accumulate and Distribute - 26th June 24
Gold Stocks Reloading - 26th June 24
Gold Price Completely Unsurprising Reversal and Next Steps - 26th June 24
Inflation – How It Started And Where We Are Now - 26th June 24
Can Stock Market Bad Breadth Be Good? - 26th June 24
How to Capitalise on the Robots - 20th June 24
Bitcoin, Gold, and Copper Paint a Coherent Picture - 20th June 24
Why a Dow Stock Market Peak Will Boost Silver - 20th June 24
QI Group: Leading With Integrity and Impactful Initiatives - 20th June 24
Tesla Robo Taxis are Coming THIS YEAR! - 16th June 24
Will NVDA Crash the Market? - 16th June 24
Inflation Is Dead! Or Is It? - 16th June 24
Investors Are Forever Blowing Bubbles - 16th June 24
Stock Market Investor Sentiment - 8th June 24
S&P 494 Stocks Then & Now - 8th June 24
As Stocks Bears Begin To Hibernate, It's Now Time To Worry About A Bear Market - 8th June 24
Gold, Silver and Crypto | How Charts Look Before US Dollar Meltdown - 8th June 24
Gold & Silver Get Slammed on Positive Economic Reports - 8th June 24
Gold Summer Doldrums - 8th June 24
S&P USD Correction - 7th June 24
Israel's Smoke and Mirrors Fake War on Gaza - 7th June 24
US Banking Crisis 2024 That No One Is Paying Attention To - 7th June 24
The Fed Leads and the Market Follows? It's a Big Fat MYTH - 7th June 24
How Much Gold Is There In the World? - 7th June 24
Is There a Financial Crisis Bubbling Under the Surface? - 7th June 24

Market Oracle FREE Newsletter

How to Protect your Wealth by Investing in AI Tech Stocks

Housing Market Boom and Bust Cycles Driven by Real House Price Values

Housing-Market / UK Housing Jun 03, 2008 - 01:52 AM GMT

By: Nadeem_Walayat

Housing-Market Best Financial Markets Analysis Article
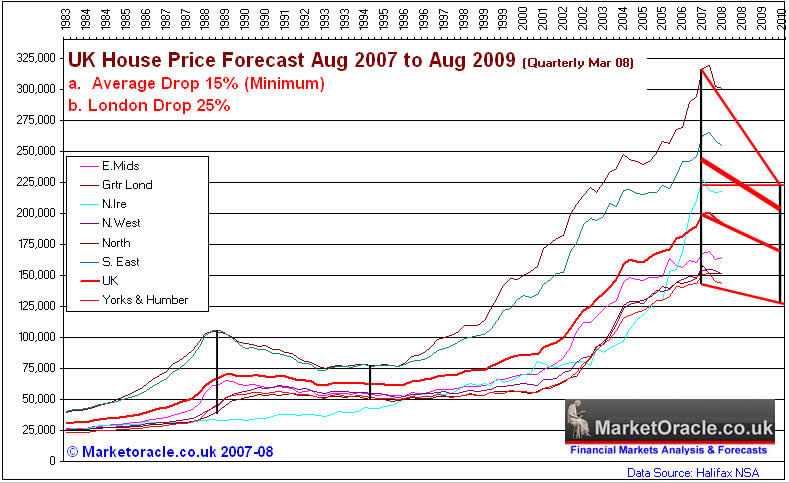
The UK housing bear market is now into its 9th month as of the peak in August 2007. This article analyses the real value of UK houses prices based on average earnings as part of ongoing preliminary analysis towards the extension of the existing 2 year housing market forecast for a 15% drop from August 2007 to August 2009.


The above graph illustrates the current average UK house prices as per the Halifax data; real house price trend based on average earnings X 3.5; and the spread between the two which indicates the overbought or oversold state of the housing market in terms of the long-term trend of rising house prices.

The key observations are -

1. That house prices were under valued from 1993 right up until 2002.

2. That the current peak in house prices was at a value of nearly £80,000 (41%) above the long-tem sustainable trend, and significantly higher than the last peak in 1989 which was at £19,000 (27%) above the long-term trend.

3. That the market tends to move between extremes of boom and busts, and therefore is expected to overcorrect to the downside before a sustainable bottom can be expected in terms of real housing market value.

4. That the real rate of house price growth is approximately 4.5% per annum .Therefore over the next 3 years real house prices are expected to rise to £143,000 against current average UK house prices of £191,852 (March 2008).

Conclusion:

The long-term housing market real valuation trend implies a decline in house prices over the next 3 years to below £143,000. This would represent a fall in house prices of 29% from the August 2007 peak, and in inflation adjusted terms would represent a decline of between 50% and 60%. The fall of approximately 5% to date is nothing compared to what is increasingly likely to follow over many years, both in terms of nominal house price falls and in terms of inflation adjusted loss of value.

Therefore home owners wanting to sell and waiting for a rebound before selling, or holding out for higher offers may need to rethink their market price expectations and bite the bullet before they are forced into a decision at much lower prices..

Current Housing Market Forecast

The UK remains on track to fulfill the current 2 year forecast for a 15% drop from August 2007 to August 2009. The growing expectations are for a sustained drop in nominal house prices of as much as 25% by mid 2011.

More Analysis of the UK Housing Market:

26 May 2008 - US and UK Housing Bear Market Trends
22 May 2008 - Council of Mortgage Lenders 2008 Housing Market Forecast Demolished
08 May 2008 - UK House Prices Tumbling- Interest Rate Conundrum
21 Apr 2008 - Bank of England Throws £50 billion of Tax Payers Money at the Banks
17 Apr 2008 - Credit Crisis SCOOP- LIBOR Is Now Irrelevant to Derivatives Pricing
08 Apr 2008 - UK House Prices Plunge Over the Cliff
01 Apr 2008 - How to Fix the Credit Markets
11 Mar 2008 - RICS Data Confirms UK Housing Market Heading for 1990's Style Crash
03 Mar 2008 - Credit Crisis Morphs Into Stagflation- Protect Your Wealth!
26 Feb 2008 - UK House Prices Fall for 5 Months in a Row- Housing Market Will Go Negative April 08
07 Feb 2008 - UK Interest Rates Cut to 5.25% - Will Not Help the Housing Market
21 Dec 2007 - UK Commercial Properties Crash Looms as Property Investment Fund Frozen
07 Dec 2007 - Analysis of Interbank and Base Interest Rate Spread
05 Dec 2007 - UK Home Owners Unable to Refinance Mortgages As Fixed Rates Expire During 2008
02 Dec 2007 - UK Housing Slump Gains Momentum as Properties Fail to Sell at Auction
10th Nov 2007 - Crash in UK House Prices Forecast for April 2008 As Buy to Let Investors Sell on Capital Gains Tax Change
28th Oct 07 - UK House Prices - Primary Reasons For a Sharp Fall
25th Sep 07 - UK Housing Market on Brink of Price Crash - Media Lessons from 1989!
22nd Aug 07 - UK Housing Market Crash of 2007 - 2008 and Steps to Protect Your Wealth
1st May 07 - UK Housing Market Heading for a Property Crash


By Nadeem Walayat

Copyright © 2005-08 Marketoracle.co.uk (Market Oracle Ltd). All rights reserved.

Nadeem Walayat has over 20 years experience of trading, analysing and forecasting the financial markets, including one of few who both anticipated and Beat the 1987 Crash. Nadeem is the Editor of The Market Oracle, a FREE Daily Financial Markets Analysis & Forecasting online publication. We present in-depth analysis from over 150 experienced analysts on a range of views of the probable direction of the financial markets. Thus enabling our readers to arrive at an informed opinion on future market direction. http://www.marketoracle.co.uk

Disclaimer: The above is a matter of opinion provided for general information purposes only and is not intended as investment advice. Information and analysis above are derived from sources and utilising methods believed to be reliable, but we cannot accept responsibility for any trading losses you may incur as a result of this analysis. Individuals should consult with their personal financial advisors before engaging in any trading activities.

Attention Editors and Publishers! - You have permission to republish THIS article if published in its entirety, including attribution to the author and links back to the http://www.marketoracle.co.uk . Please send an email to republish@marketoracle.co.uk, to include a link to the published article.

Nadeem Walayat Archive

© 2005-2022 http://www.MarketOracle.co.uk - The Market Oracle is a FREE Daily Financial Markets Analysis & Forecasting online publication.


Comments

Nayem
04 May 09, 09:53
Is it possible to model UK historical house prices against M3 Money Supply

Many have observed house prices historically move in line with the M3 Money Supply.

Could you produce such a chart - dating as far back as possible? The benefit would be:

a) Identifying how house prices have historically reacted during inflationary periods.

b) The projected impact quantitative easing may have on house prices moving forward.

Regarding point b) above, there are conflicting arguments. Some say that during inflationary periods, rates rise which result in house prices significantly falling. Others argue that the debasing of currency / 'money' encourages people to shift money into hard assets, therefore pushing house prices higher.

Your analysis on this would be interesting.

Keep up the great work.

Nayem


Nadeem_Walayat
04 May 09, 11:45
UK house Prices

As part of my update to the UK recession forecast, I will be updating the housing market current state later today and will incorporate trend against money supply as requested.

Best


ali
19 Jan 10, 06:33
housing boom

The should have tried harder regulation to prevent the next housing boom.


Post Comment

Only logged in users are allowed to post comments. Register/ Log in