


U.S. Dollar’s Major Breakout and Gold’s Simultaneous Rally
Commodities / Gold and Silver 2015 Jan 19, 2015 - 07:53 PM GMTBy: P_Radomski_CFA

 Briefly: In our opinion no speculative positions are currently justified from the risk/reward perspective. Being on the long side of the precious metals market with half of the long-term investment capital seems justified from the risk/reward perspective.
Gold soared on Friday once again and so did the USD Index. It was yet another day of the two rallying together, which is a very bullish development. What’s next?
We generally don’t post alerts when the markets are closed, but we decided to update you this time anyway, as quite a lot happened last week and we thought that posting a comment today would be useful to you.
The medium-term outlook has improved greatly, but not based on what most market participants (individual investors, mutual- and gold hedge funds, etc.) think. The most recent move higher is not what improved it – we have already seen significant – yet counter-trend – rallies in the past years, which didn’t change the medium-term trend, so why should this one be any different? The real difference comes from the situation in the gold-USD link and the gold link to the bond market. Let’s start today’s alert with the USD Index (charts courtesy of http://stockcharts.com).
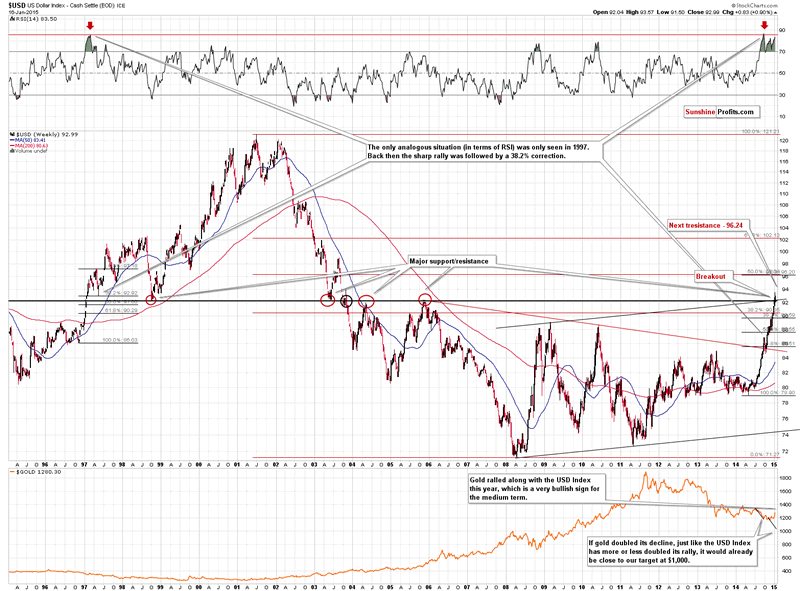
The USD Index moved and – more importantly – closed the week above the resistance level. We have just seen a breakout.
The USD Index had been trading below the resistance for some time and it paused at the cyclical turning point. Perhaps the pause was the effect that the turning point had – the trend might have been too strong for this signal to generate a decline.
The breakout has not yet been verified, but a weekly close above the resistance (quite visibly above it) is quite meaningful. The situation is not very bullish yet, but it’s more bullish than not at this time. The next resistance is slightly above the 96 level, so there’s quite significant upside potential.
The above has bearish implications for the gold market, however, given gold’s recent ability to rally along with the USD, we could expect the bearish implications to be delayed. Let’s check the signal from the bond market.
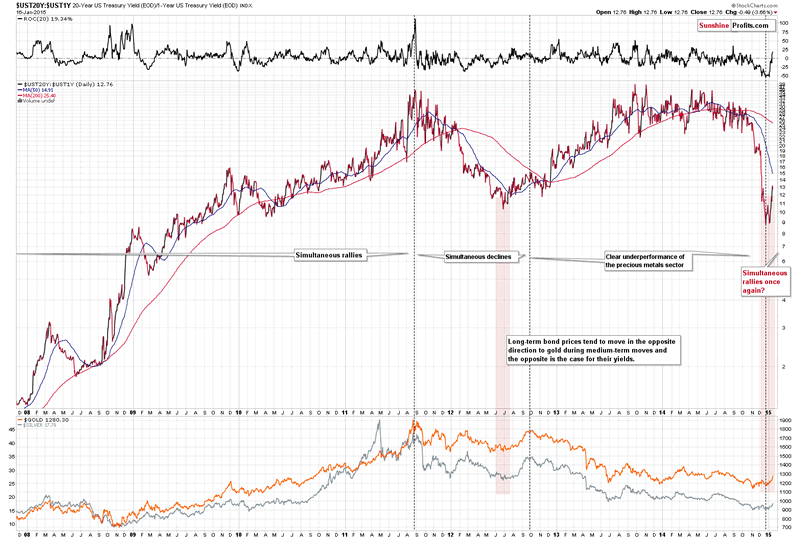
Let’s be clear – the above chart doesn’t have meaningful short-term implications. It covers many years to filter-out the short-term price sings and focus on the main trends. The relationships between major economic indicators, such as gold and bond prices, don’t have to work in the short term – they are not technical tools. The way the two markets react to each other can tell us something about the major trends, though.
We divided the entire period into 4 sub-periods. Before mid-2011 both gold and the ratio of 20-year to 1-year bond yields rallied. Then they both declined for about a year. After that the ratio moved higher, while gold declined. The early divergence was a bearish sign indicating a major decline.
In the final weeks of 2014 we saw something different. The gold market finally reacted to the moves in the bond market. The huge decline in the ratio wasn’t able to push gold price lower but gold reacted visibly to a move up in the ratio. They are both rallying together this year. This suggests that the next big change in the precious metals market “is here” and that it was a very good decision to get partly back on the long side of the market with the long-term investments a few tens of dollars ago in the case of gold.
On the above chart, we’ve marked the only situation that was similar to the current one – the 2012 bottom. Both the ratio and gold bottomed after a visible decline and then started to rally together. Back then it meant that a rather significant rally would follow in gold. However, there was some back and forth trading before gold moved much higher.
Will gold decline or rally shortly?
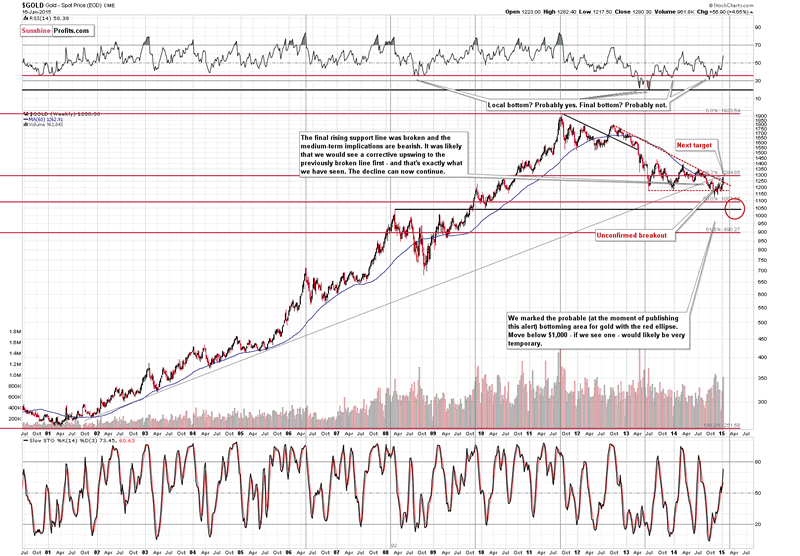
Gold moved visibly higher above the declining resistance line and ended the session close to the 38.2% Fibonacci retracement level based on the 2001 – 2011 rally, which was a significant support at the time and now could provide resistance. The next significant resistance is at about $1,300, which is not only a psychologically important number (being a round one) – it’s also where the rising very long-term resistance line is currently located.
Please note that the long-term cyclical turning point is very close. The previous turning point was due in mid-2013 and the major bottom materialized several weeks after that point. Perhaps it will be the case once again, which means that we could see a bottom after April or so. It’s not a very strong bearish factor, but we’d say it’s something worth keeping in mind – especially given the breaking-out USD Index.
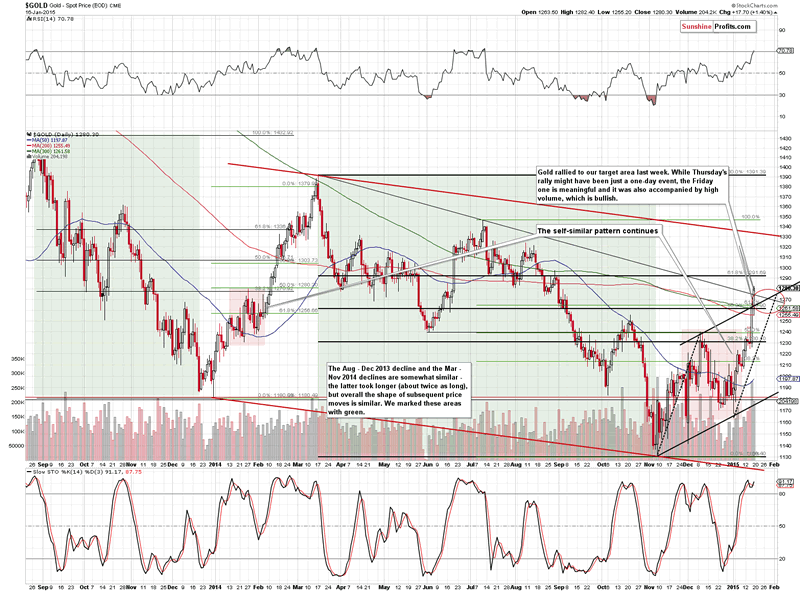
Gold broke above the medium-term resistance line and several other resistance levels, but this move has not been verified, and if the USD Index keeps rallying, it might not be verified. On the other hand, the self-similar pattern that we marked on the above chart in green and red remains in place, which has bullish implications as back in Feb. 2014 gold rallied even higher before stopping.
The RSI indicator just moved above 70, which means that the rally could pause or stop shortly. In June 2013 gold kept rallying for a few more weeks, but it didn’t move much higher. We could be in this type of situation once again.
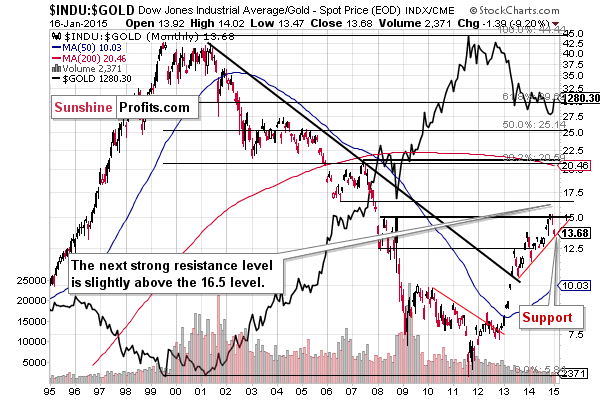
In our previous alert, we wrote the following:
Because of the rising red support line, the Dow to gold ratio chart tells us that this ratio could move lower, but it’s not likely to move much lower before stopping or pausing. This means that gold could move higher but not likely much higher before stopping or pausing.
Gold has indeed moved higher and the ratio has moved lower, reaching the support line. The implications are bullish for the ratio and bearish for gold.
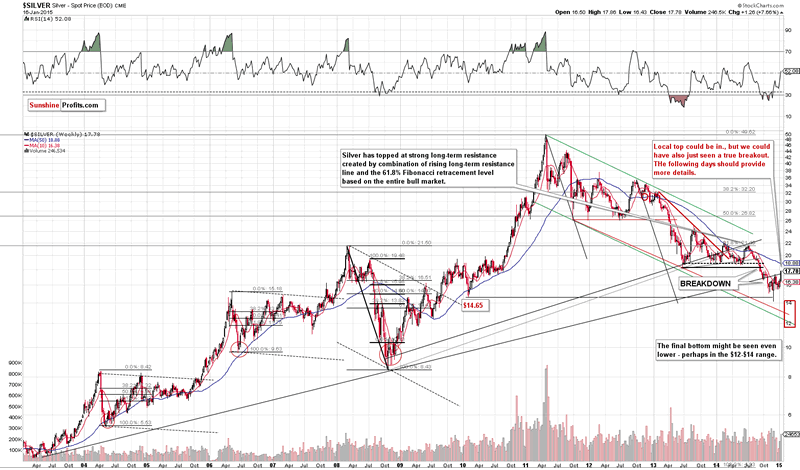
Silver moved back slightly above the very long-term, rising resistance line, which seems bullish, but let’s keep in mind that silver tends to “fake out” instead of “breaking out”. Breakouts are often signs of a looming decline, which makes us skeptical toward this “traditionally bullish” development.
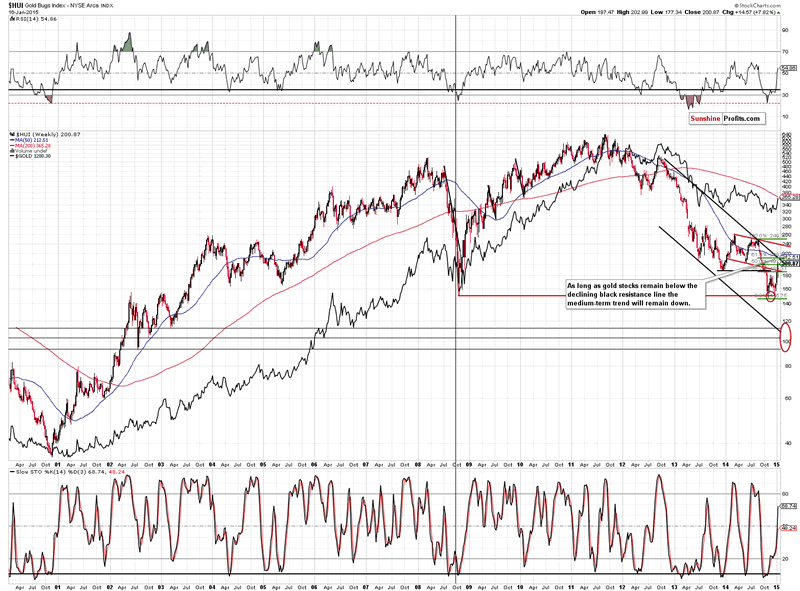
Gold stocks corrected about half of their recent decline, but the strongest resistance was not reached. The 3 important resistance levels intersect close to the 210 level: the 61.8% Fibonacci retracement, the 50-week moving average, and – most importantly – the declining long-term resistance line. If gold stocks manage to break and confirm the breakout above this level, it might serve as a confirmation that another major upswing is underway. For now, the current rally looks similar to the corrections that saw in July 2013, in late-2013 to early-2014, and in June 2014.
Summing up, while there are some signs that this rally might be the beginning of another major upleg in the precious metals market, it’s still more likely than not that it’s just a correction. Gold seems to be once again responding very positively to the signs from the bond market, but if the USD Index keeps rallying, the yellow metal might give up its recent gains and decline once again. Whether it declines significantly or not, it could be the case that we’re just one decline away from the final bottom before the next major rally.
That’s the clearest thing that we can say based on the current situation in many markets. Things are not as clear regarding the very short-term outlook. Gold could decline based on the USD’s strength or simply because the short-term breakouts have not been confirmed yet. It could move higher based on the self-similar pattern that has been working very well in the recent weeks. It seems that “when in doubt, stay out” is a justified approach at this time. Things might become clearer in the coming days or weeks. We’ll keep you – our subscribers – informed.
To summarize:
Trading capital (our opinion): No positions
Long-term capital (our opinion): Half positions in gold, half positions in silver, half position in platinum and half position in mining stocks.
Insurance capital (our opinion): Full position
You will find details on our thoughts on gold portfolio structuring in the Key Insights section on our website.
As always, we'll keep our subscribers updated should our views on the market change. We will continue to send them our Gold & Silver Trading Alerts on each trading day and we will send additional ones whenever appropriate. If you'd like to receive them, please subscribe today.
Thank you.
Przemyslaw Radomski, CFA
Founder, Editor-in-chief
Tools for Effective Gold & Silver Investments - SunshineProfits.com
Tools für Effektives Gold- und Silber-Investment - SunshineProfits.DE
* * * * *
About Sunshine Profits
Sunshine Profits enables anyone to forecast market changes with a level of accuracy that was once only available to closed-door institutions. It provides free trial access to its best investment tools (including lists of best gold stocks and best silver stocks), proprietary gold & silver indicators, buy & sell signals, weekly newsletter, and more. Seeing is believing.
Disclaimer
All essays, research and information found above represent analyses and opinions of Przemyslaw Radomski, CFA and Sunshine Profits' associates only. As such, it may prove wrong and be a subject to change without notice. Opinions and analyses were based on data available to authors of respective essays at the time of writing. Although the information provided above is based on careful research and sources that are believed to be accurate, Przemyslaw Radomski, CFA and his associates do not guarantee the accuracy or thoroughness of the data or information reported. The opinions published above are neither an offer nor a recommendation to purchase or sell any securities. Mr. Radomski is not a Registered Securities Advisor. By reading Przemyslaw Radomski's, CFA reports you fully agree that he will not be held responsible or liable for any decisions you make regarding any information provided in these reports. Investing, trading and speculation in any financial markets may involve high risk of loss. Przemyslaw Radomski, CFA, Sunshine Profits' employees and affiliates as well as members of their families may have a short or long position in any securities, including those mentioned in any of the reports or essays, and may make additional purchases and/or sales of those securities without notice.
Przemyslaw Radomski Archive |
© 2005-2022 http://www.MarketOracle.co.uk - The Market Oracle is a FREE Daily Financial Markets Analysis & Forecasting online publication.